Dashboards
Importable Grafana dashboards (PromQL) live under grafana/dashboards/. Each
subdirectory becomes a Grafana folder (the provisioning provider uses
foldersFromFilesStructure: true), and the whole tree is mounted with a single
docker-compose volume:
overview/—00-fleet-health(health/alerts/staleness landing + drill links) and01-cluster-overview(fleet performance + capacity rollup).block/—02-appliances,03-volumes,04-volume-groups,05-capacity,06-ports.file/—01-file-systems(capacity + performance).protection/—01-replication(DR session state, RPO, backlog, transfer rate).hardware/—01-drives(drive state, wear level, active alerts).
Every dashboard shares one design system: a datasource + array template variable
(label_values(powerstore_up, array), multi/All), collapsible rows, consistent units
and thresholds, fixed read=blue / write=orange series colors, and a tag-based dashboard
links dropdown (powerstore) plus data links that drill down carrying $array.
Gallery
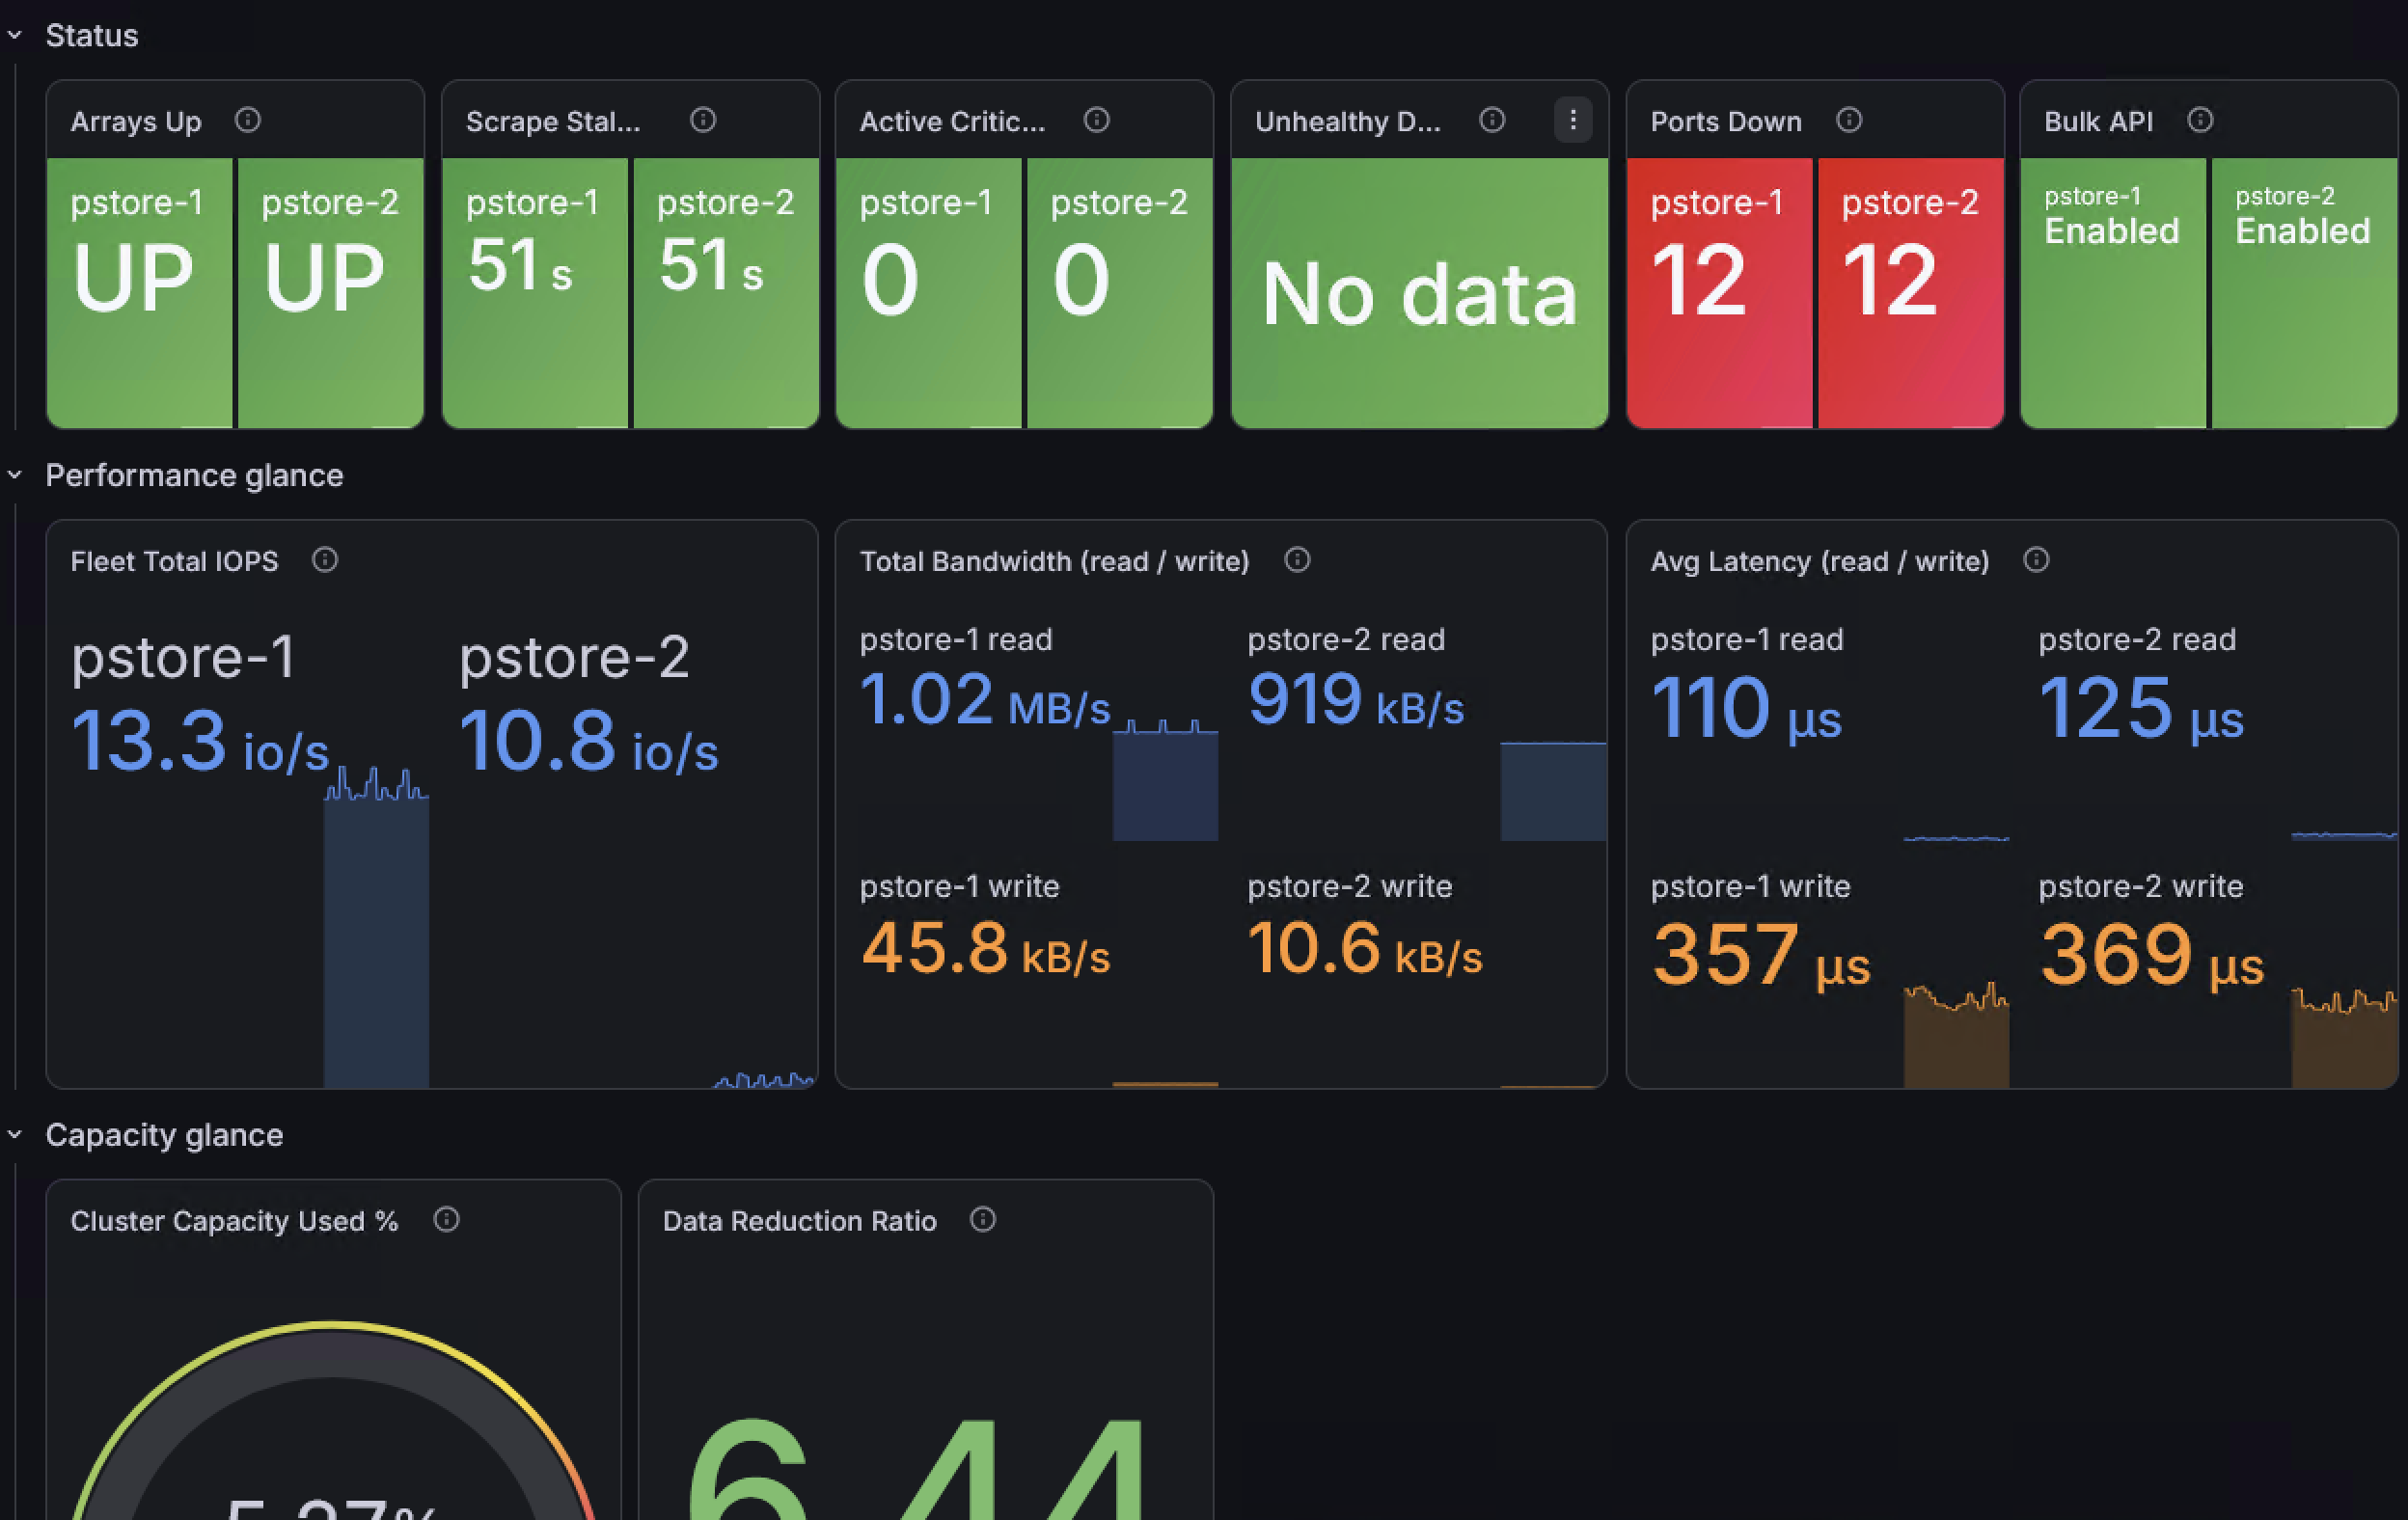
overview / 00-fleet-health
Landing page: per-array up state, scrape staleness, active critical alerts, ports down,
bulk-API capability, plus performance and capacity glances with drill-down links.
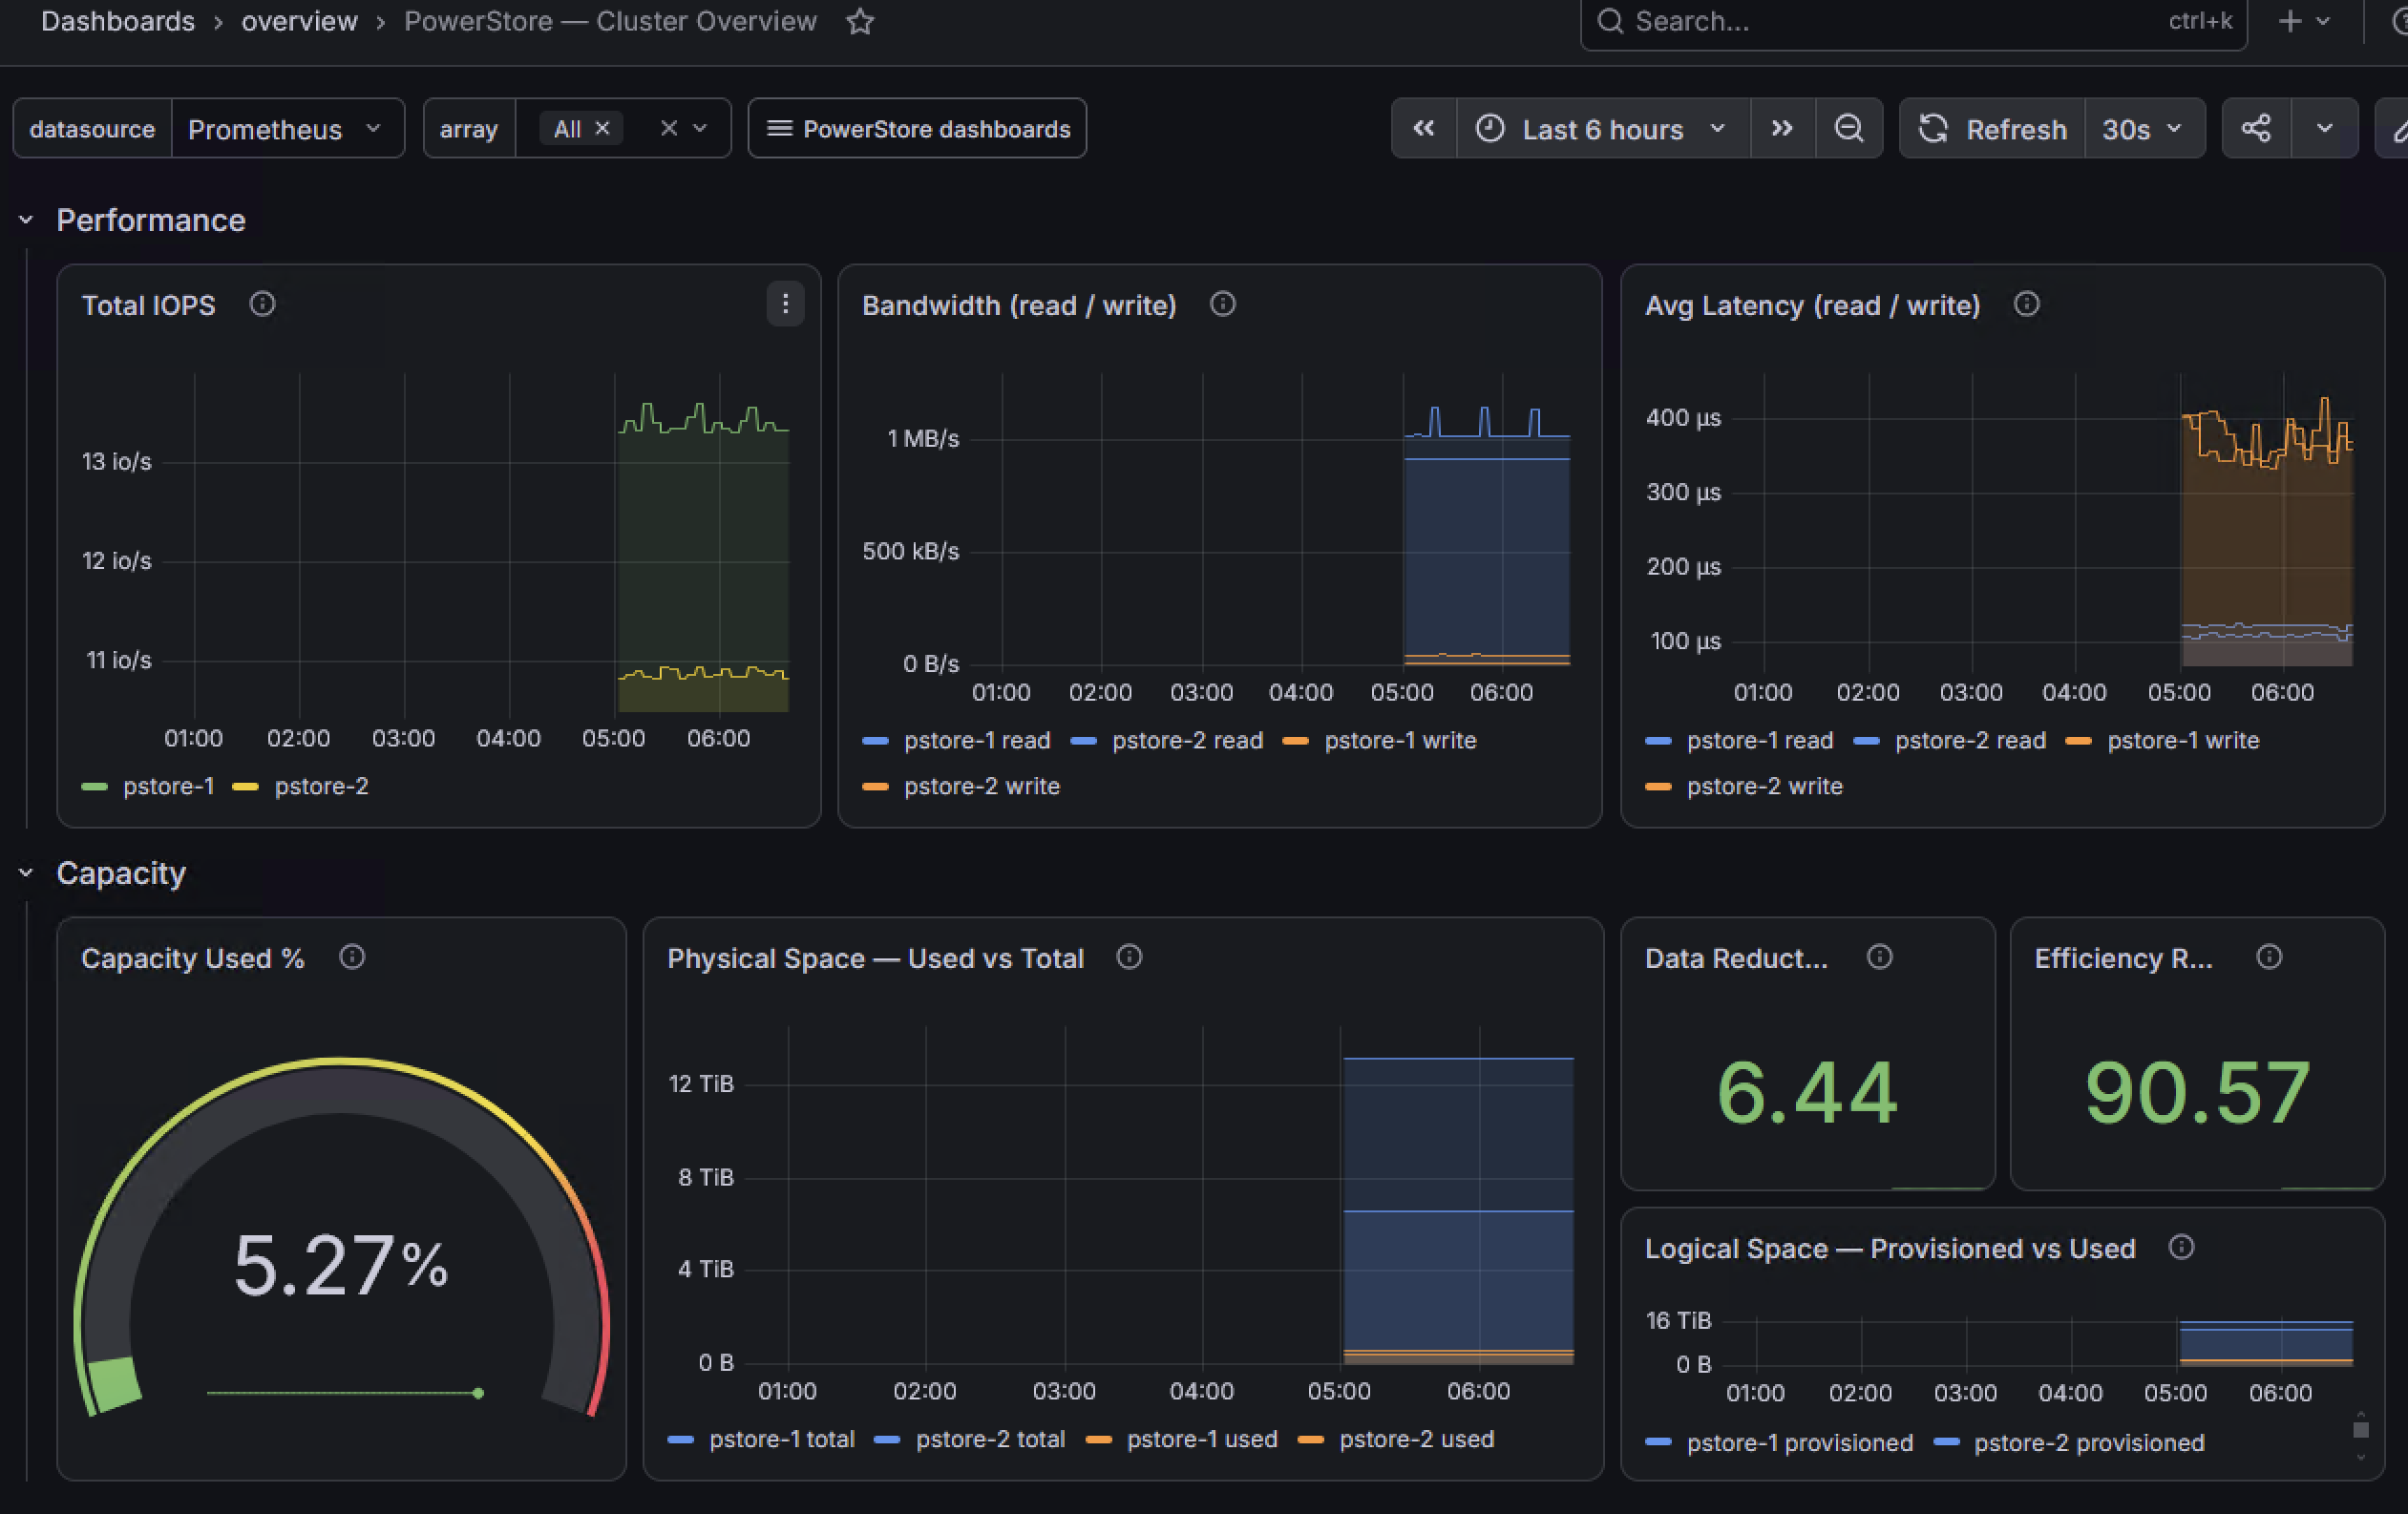
overview / 01-cluster-overview
Fleet performance (IOPS, bandwidth, latency) and capacity rollup per array.
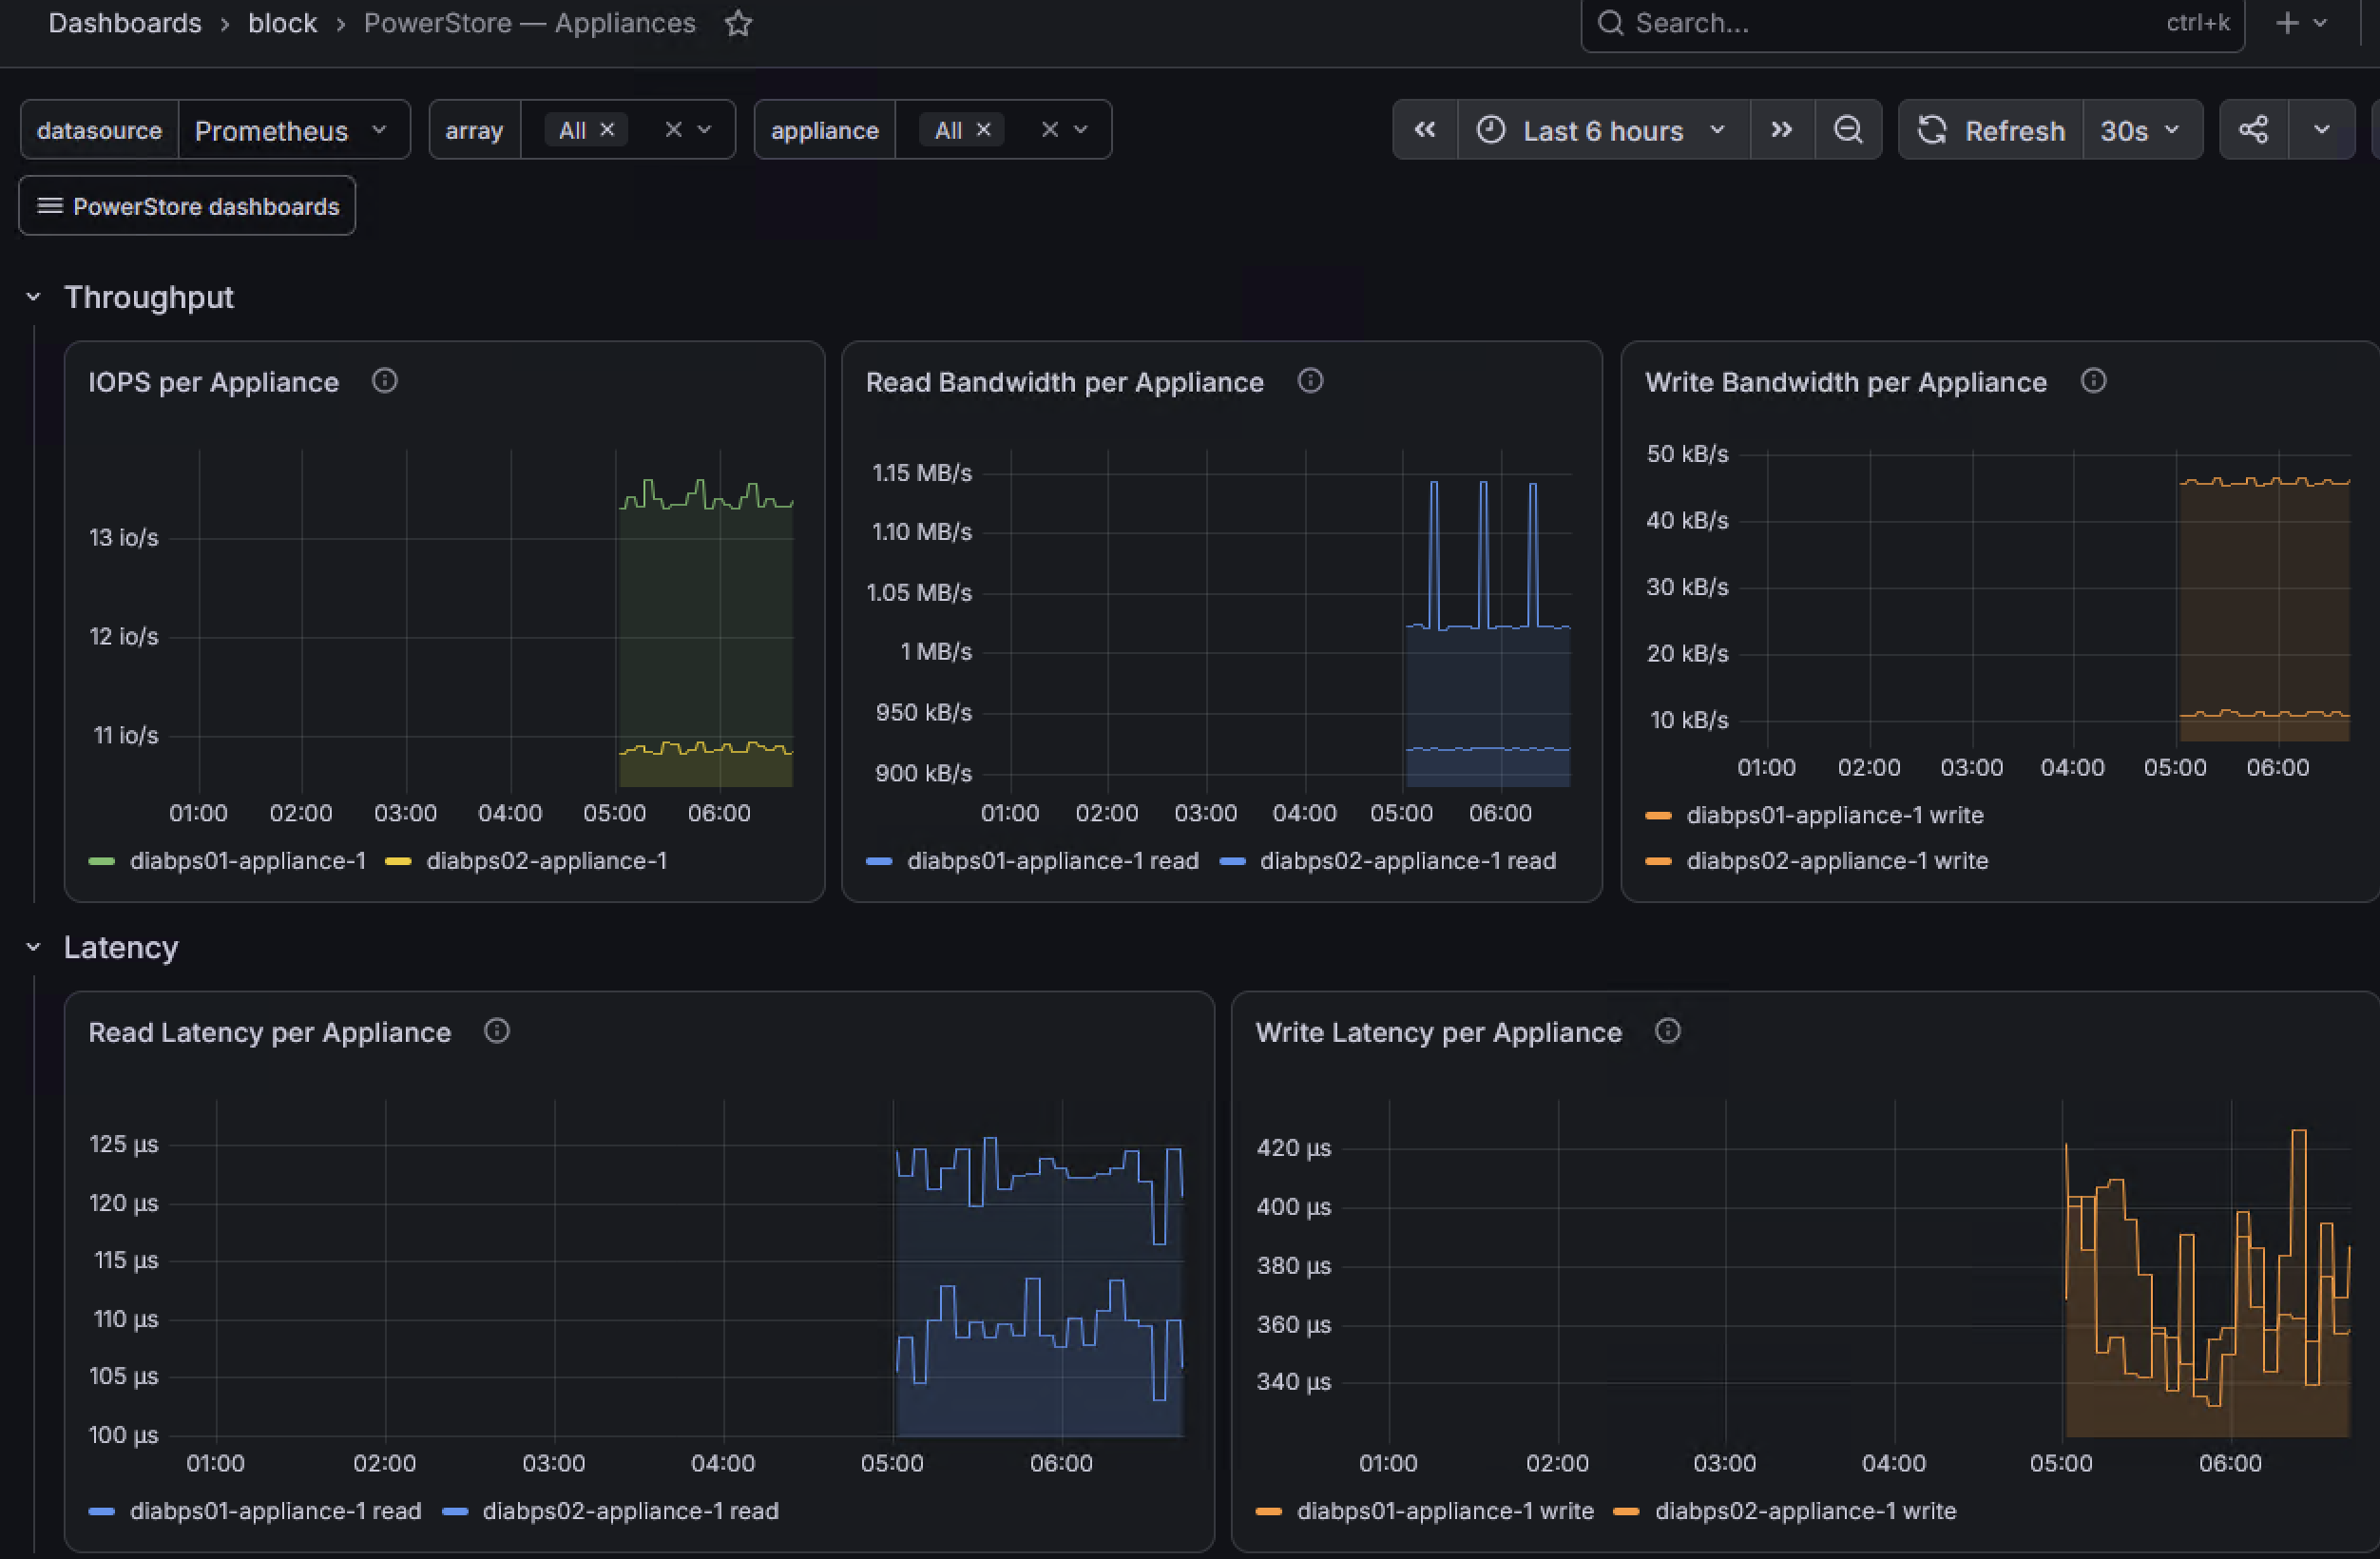
block / 02-appliances
Per-appliance throughput and latency, filtered by the $array and $appliance variables.
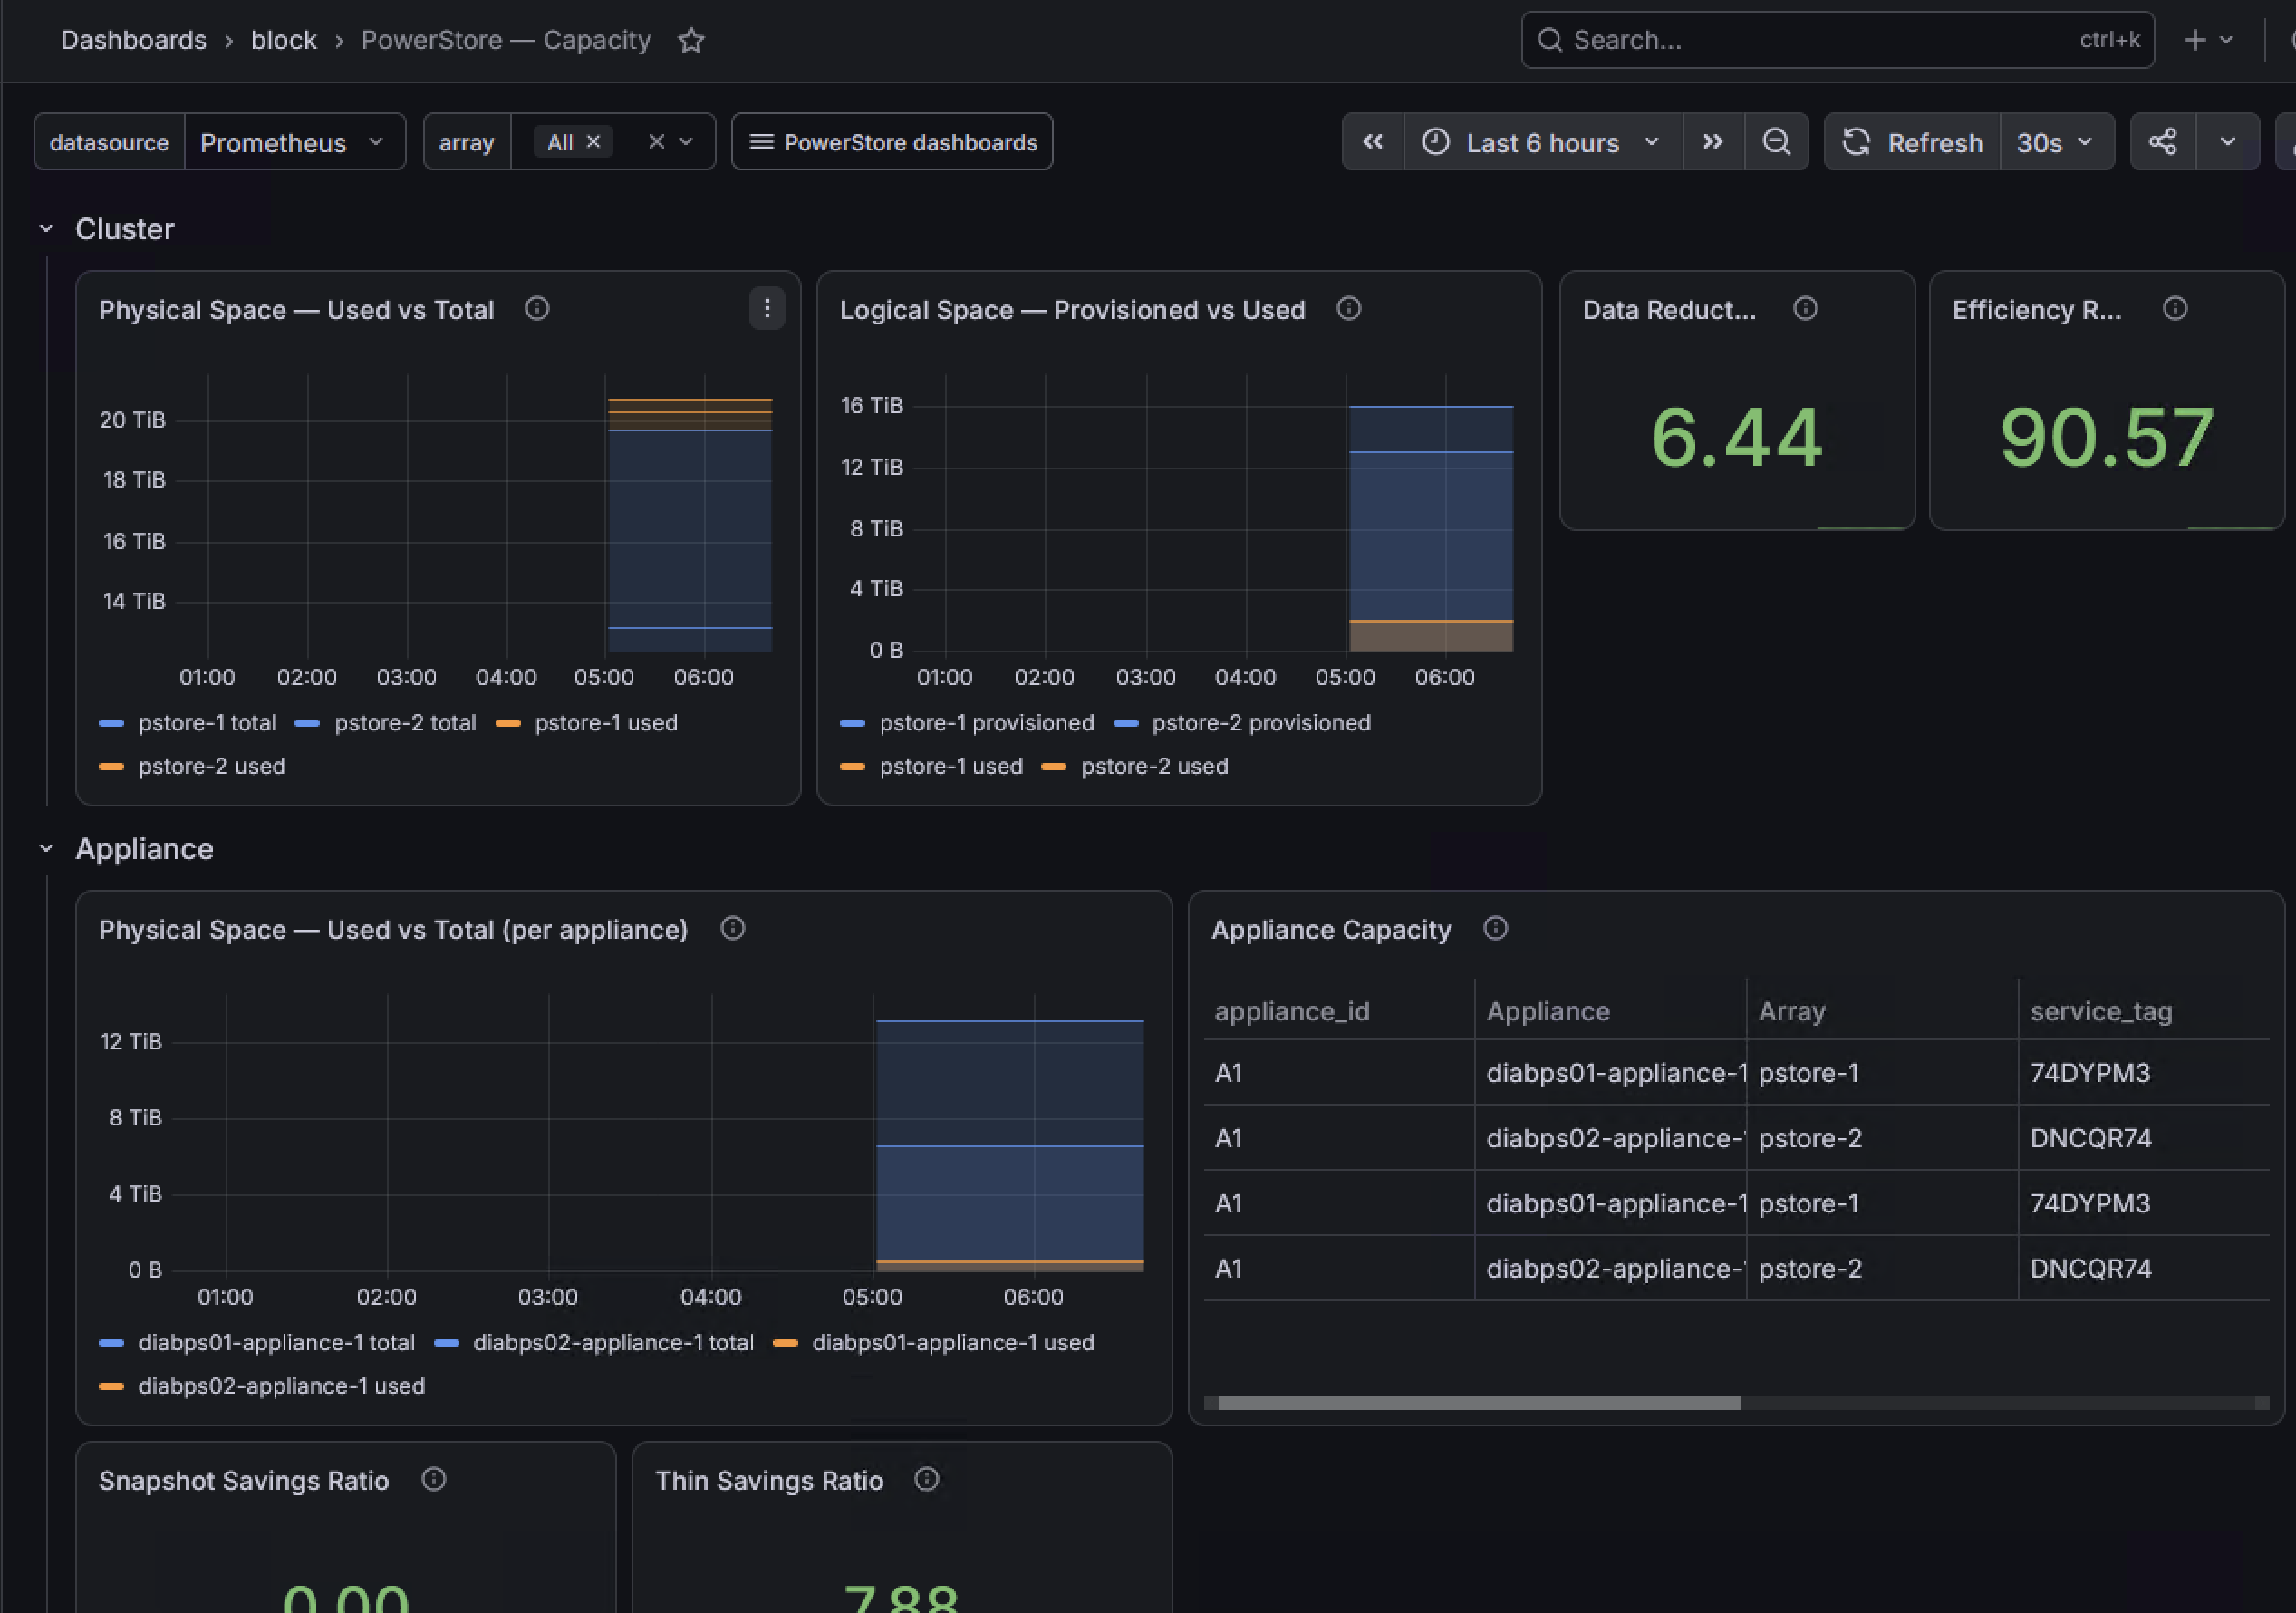
block / 05-capacity
Cluster and per-appliance physical/logical space, data reduction, efficiency, snapshot and thin savings ratios.
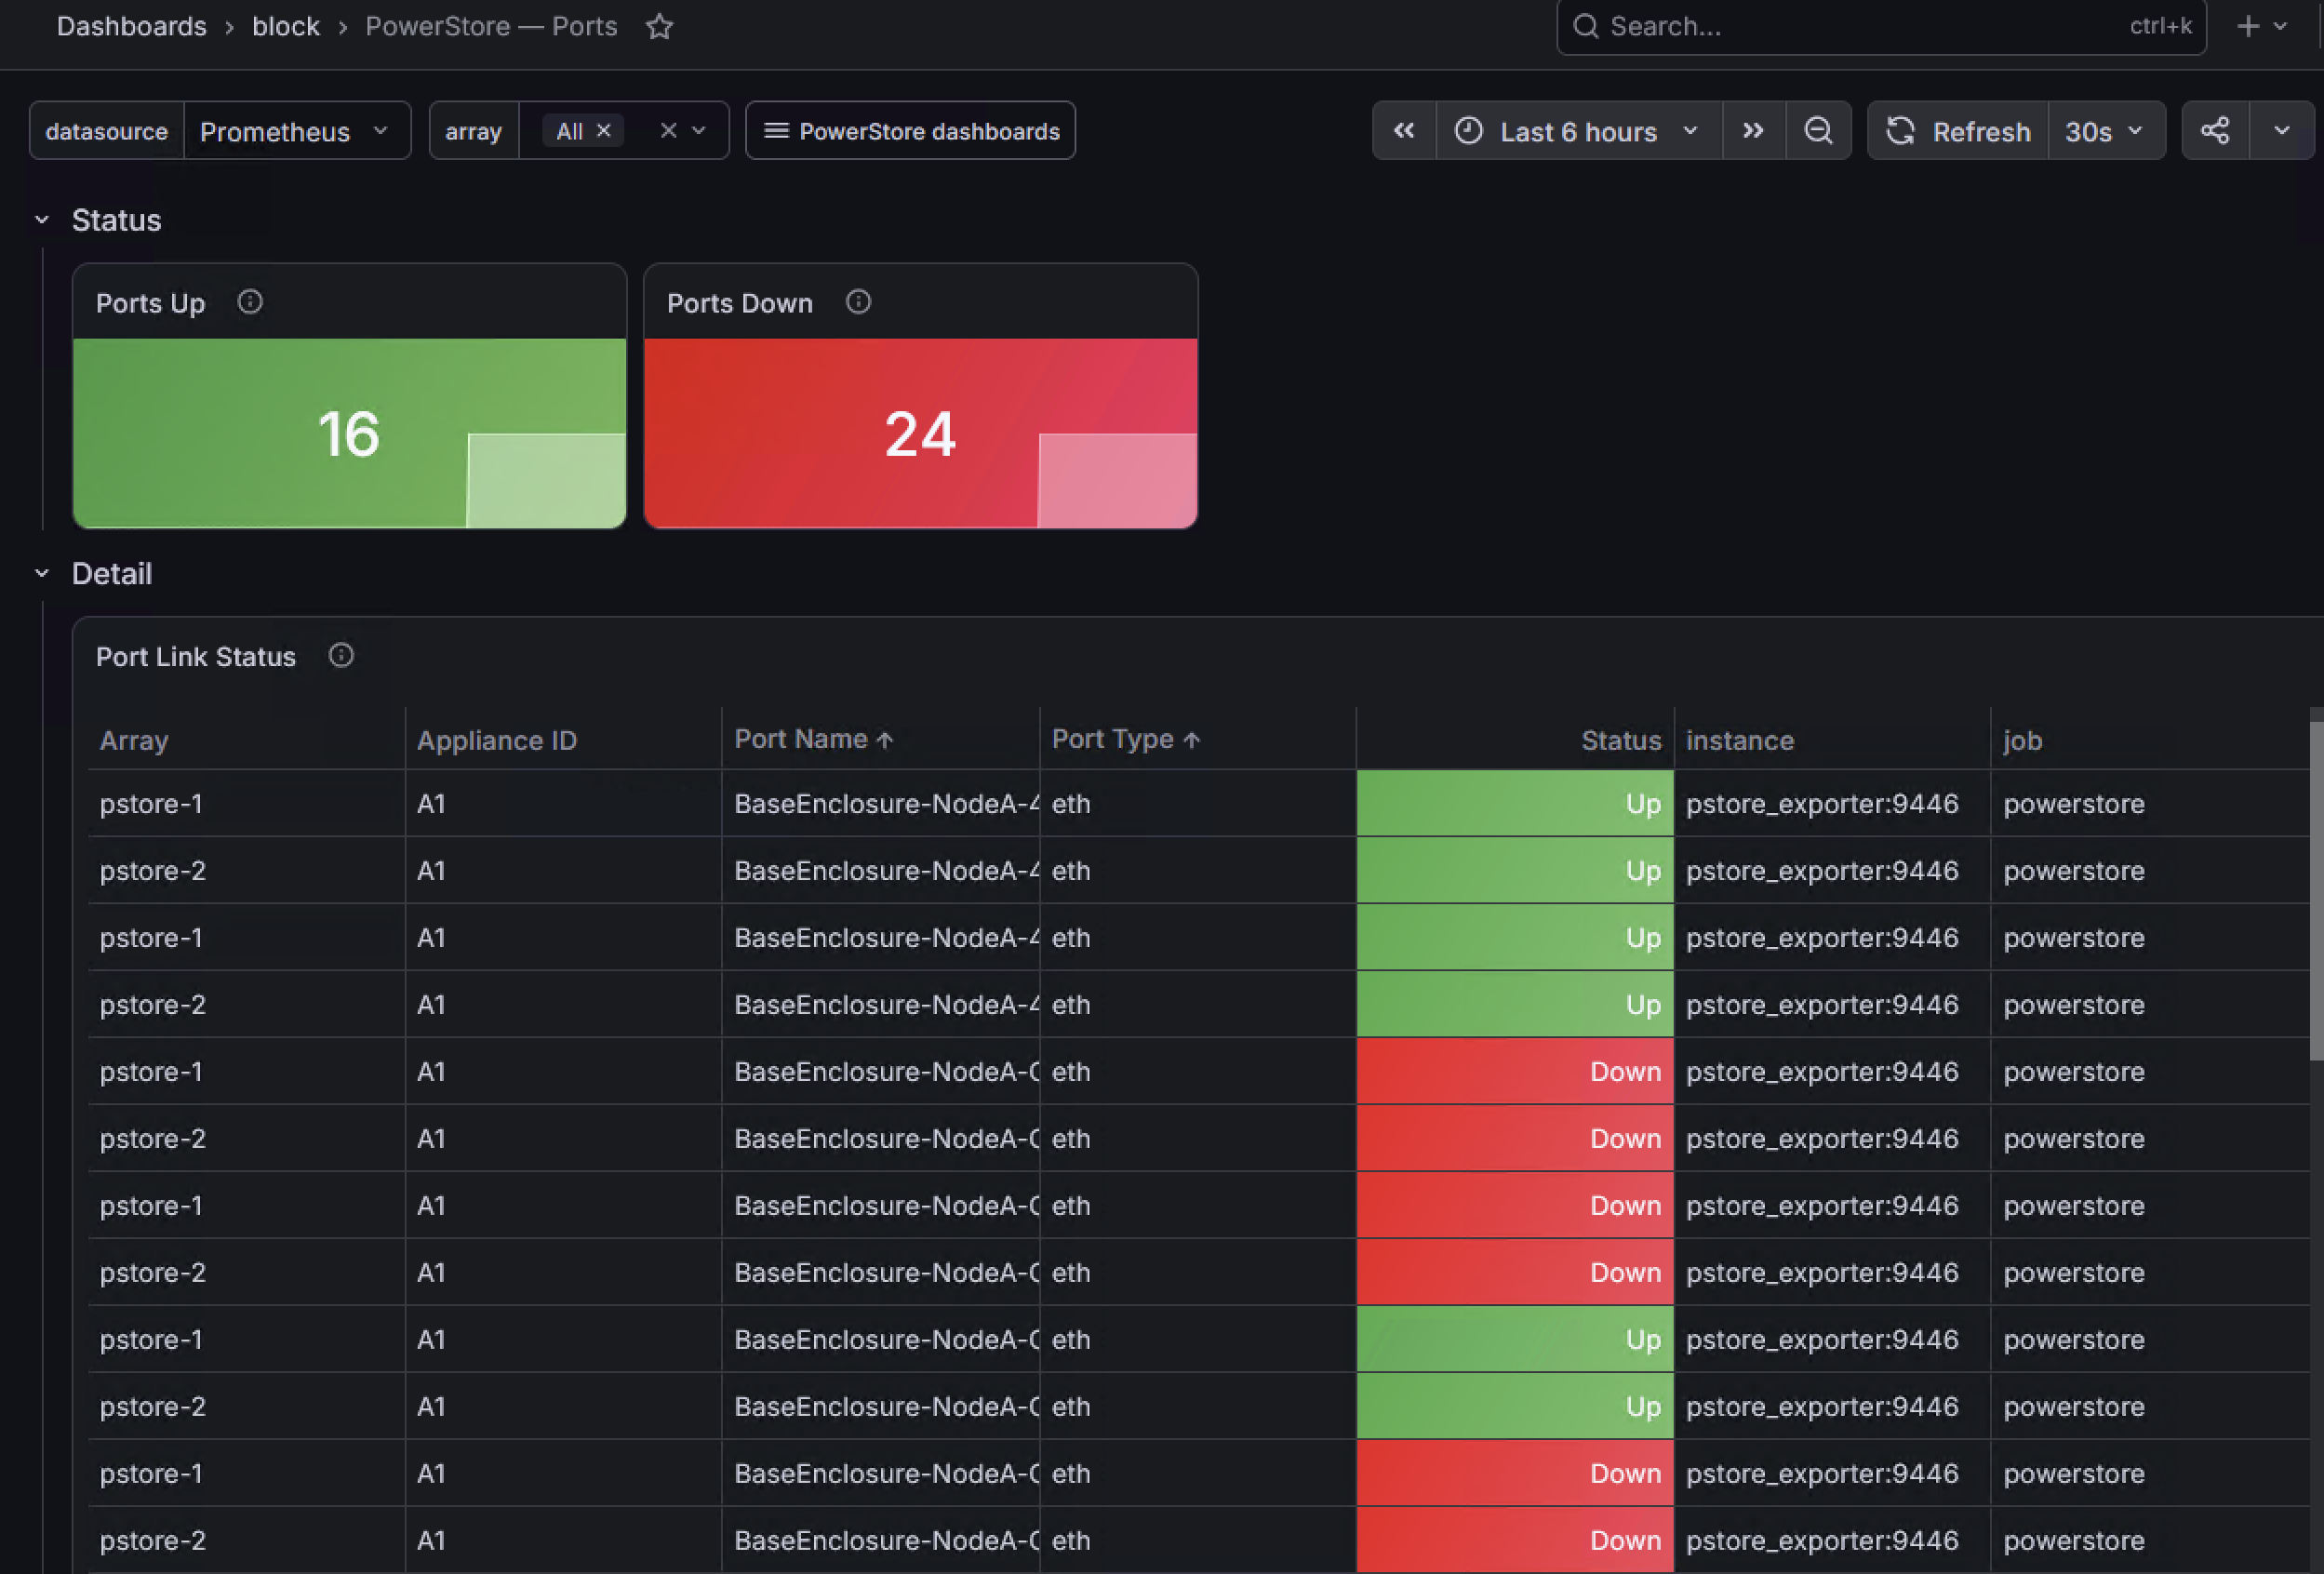
block / 06-ports
Ports up/down counters and a per-port link-status table.
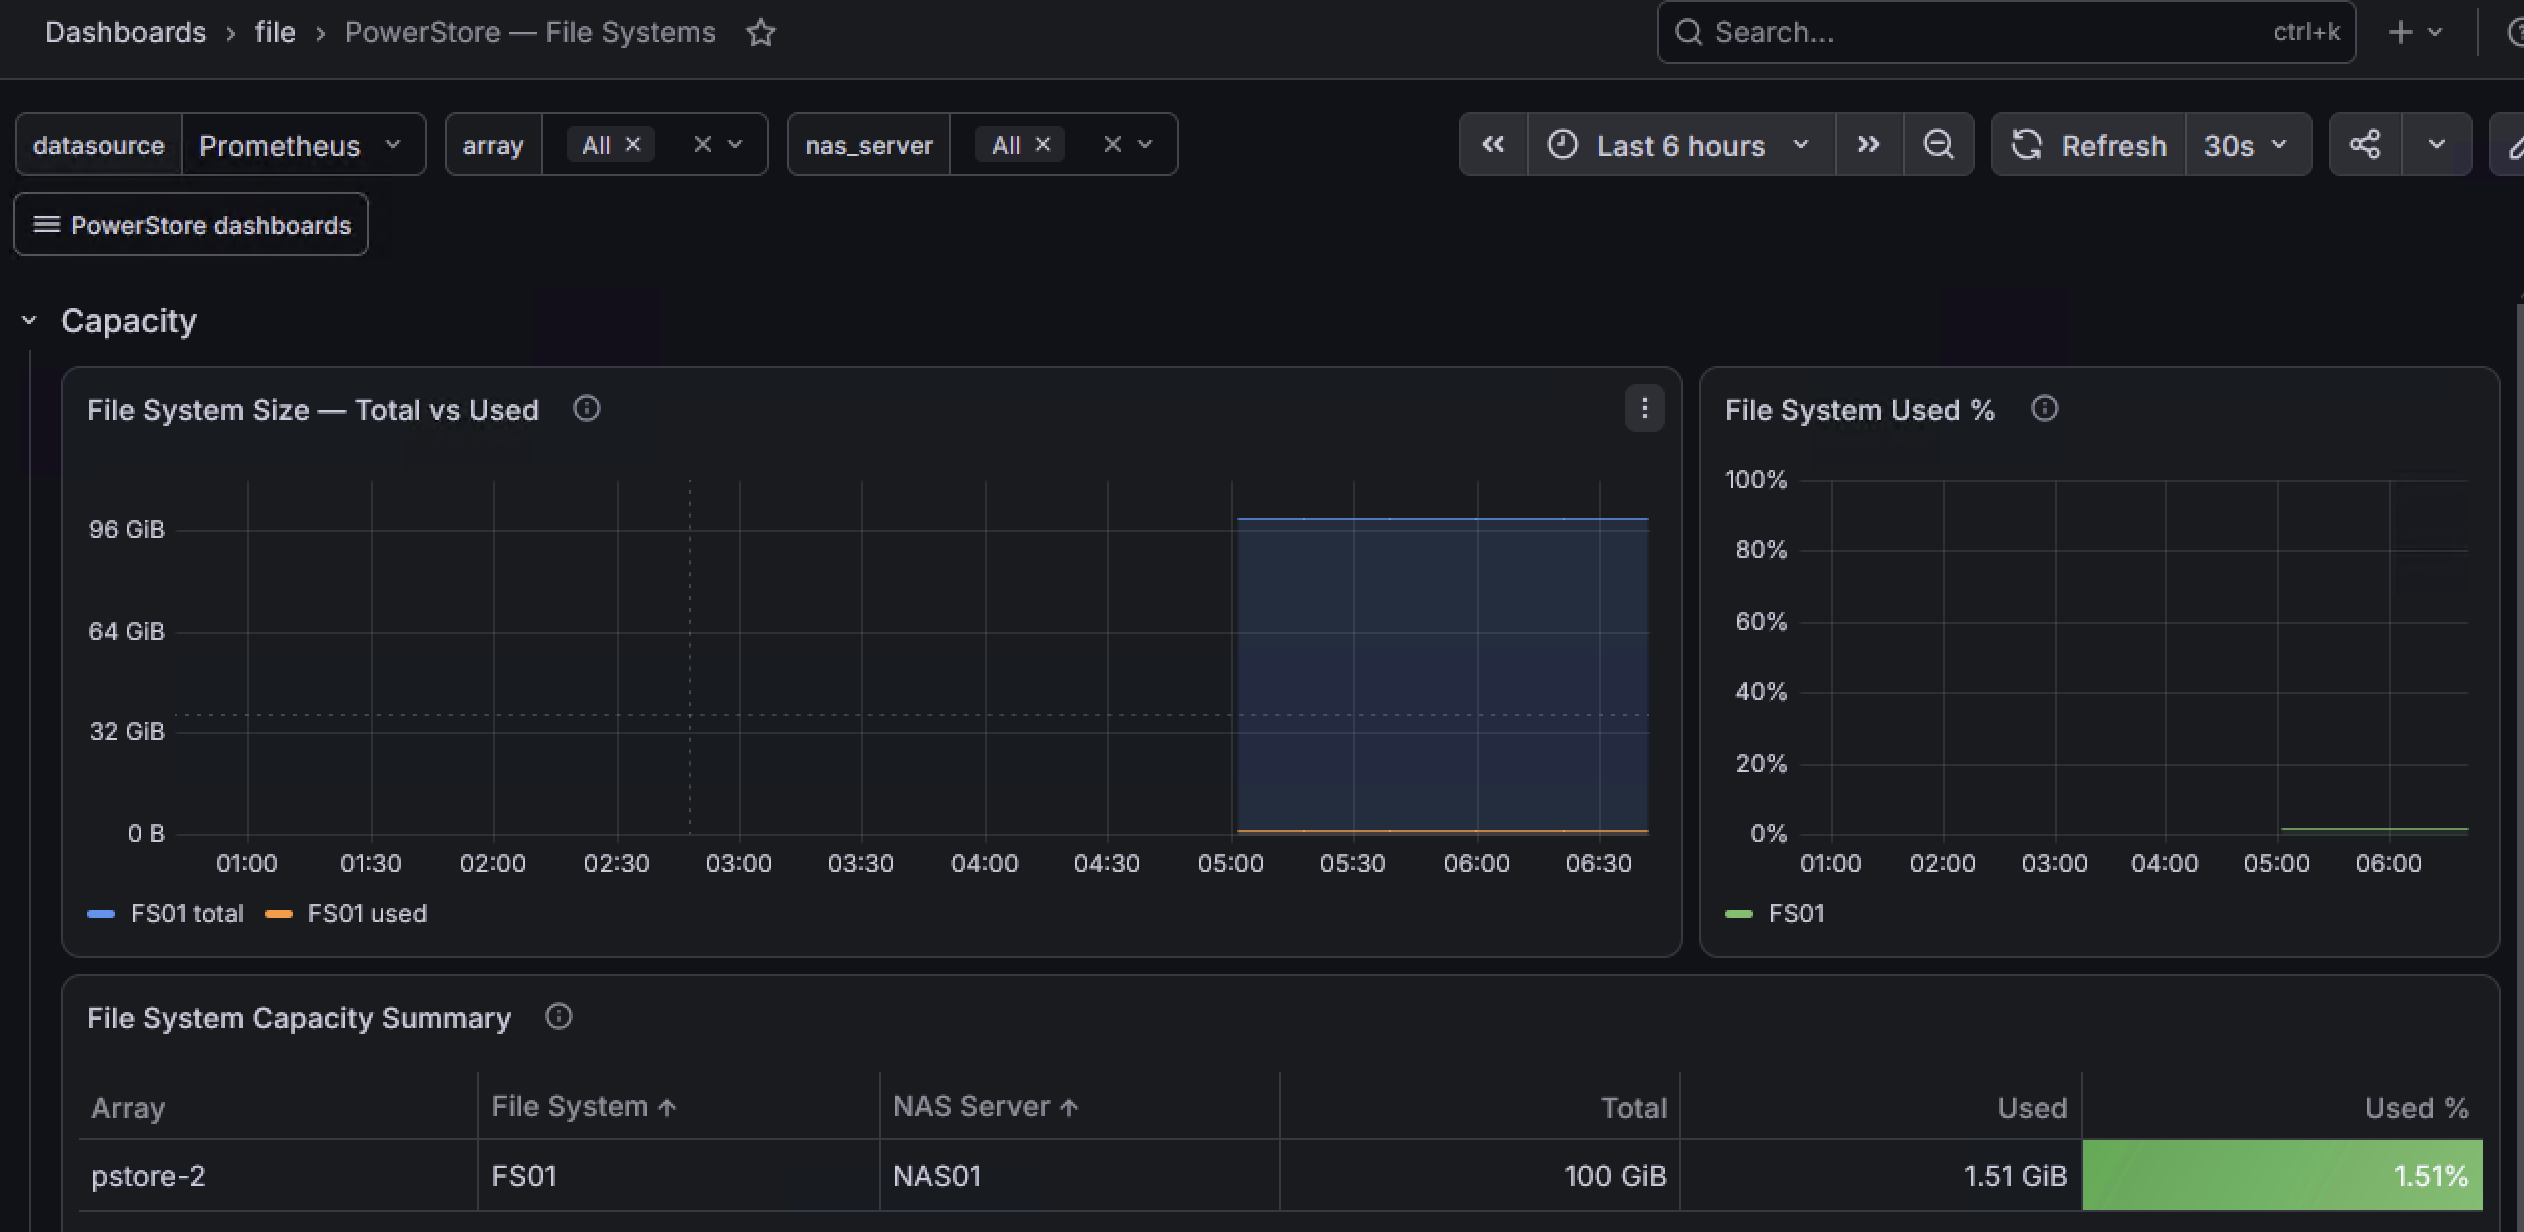
file / 01-file-systems
File system size, used %, and a capacity summary table per NAS server.
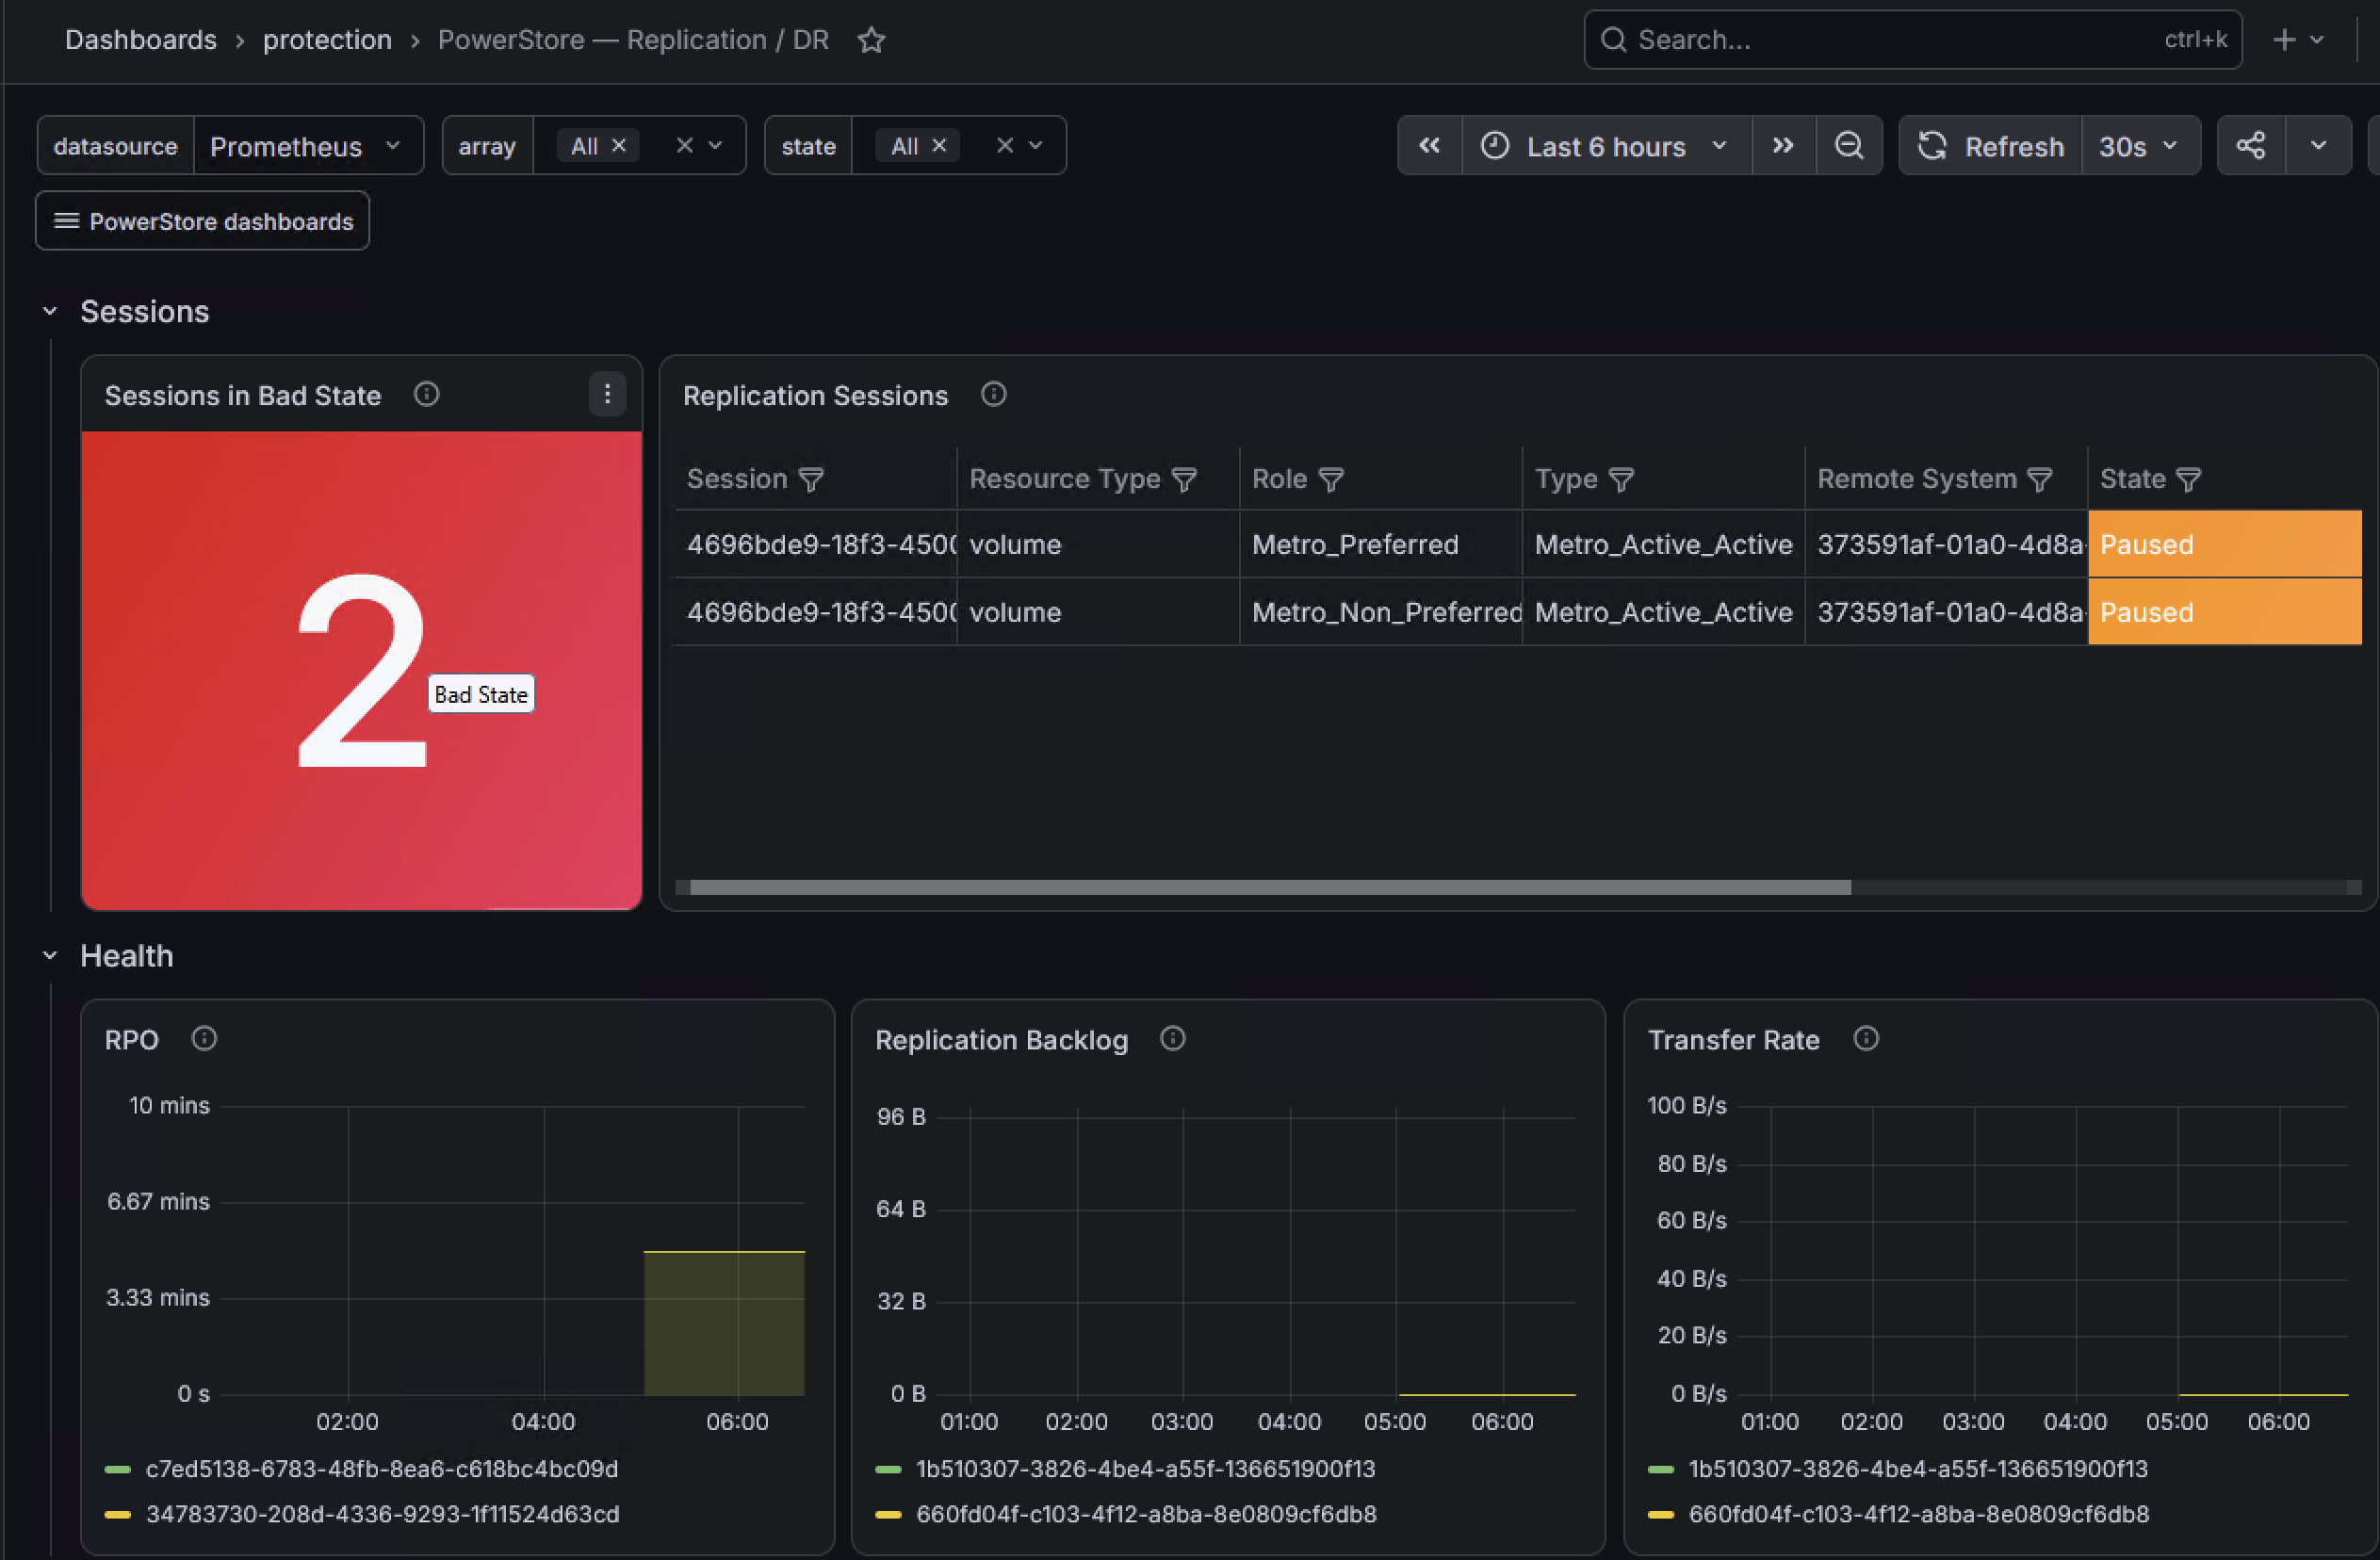
protection / 01-replication
Replication session state (including Metro), RPO, backlog, and transfer rate.
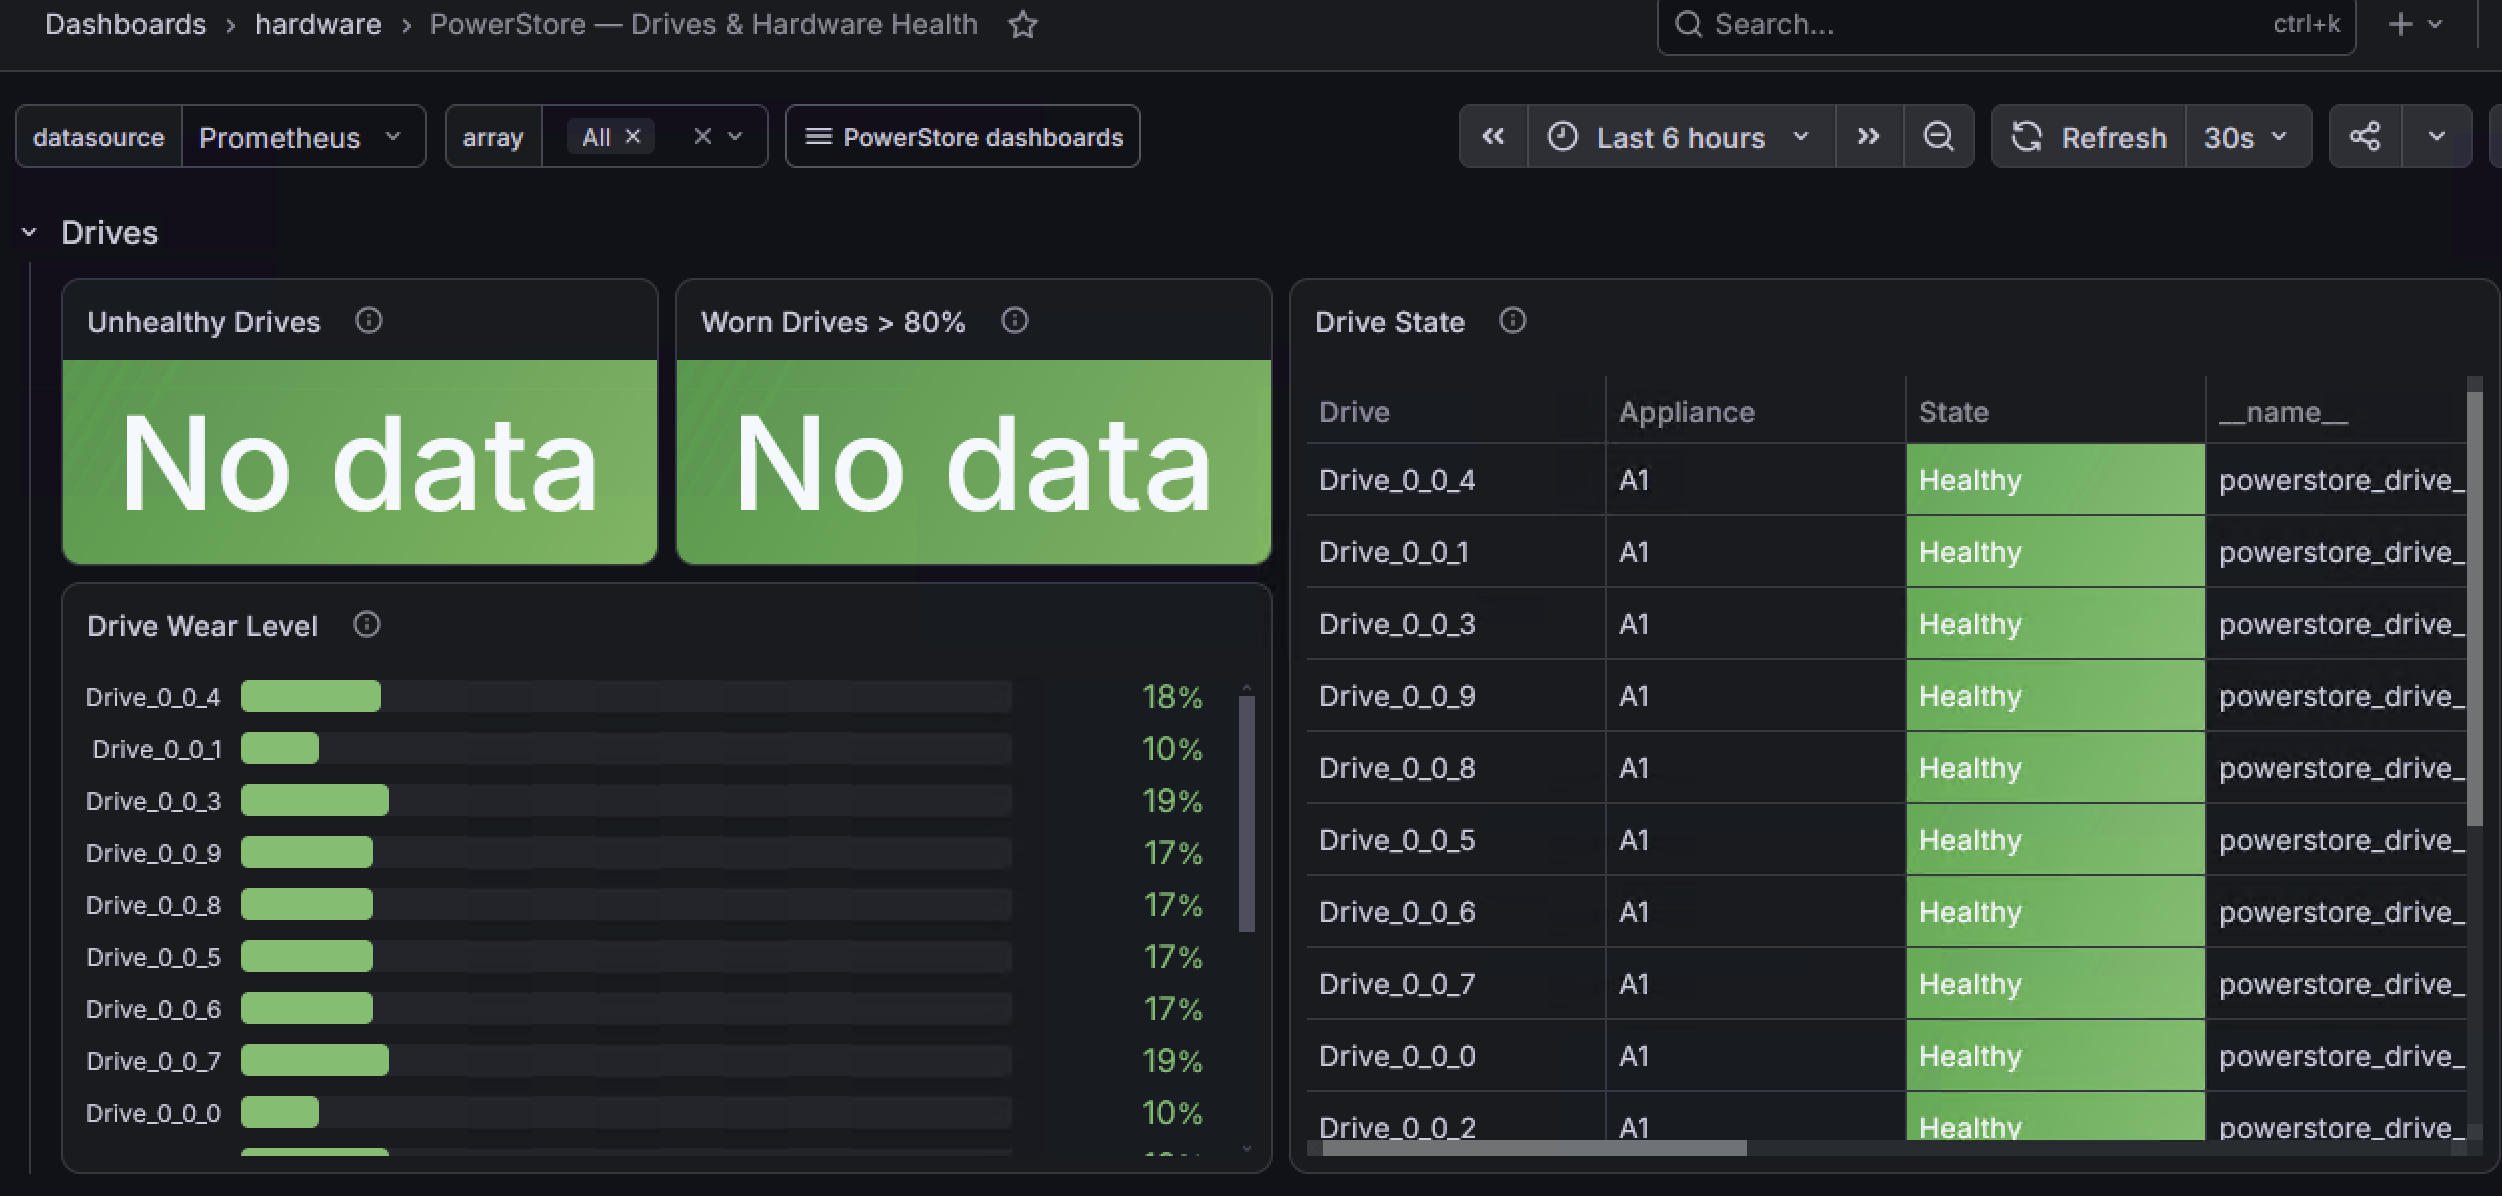
hardware / 01-drives
Drive state, wear level, unhealthy and worn-drive counters.
Import
In Grafana: Dashboards → New → Import, upload the JSON, and select your Prometheus
data source. Each dashboard uses a $array template variable (and the appliance dashboard
also an $appliance variable).
PromQL conventions
- Metrics are gauges;
array,appliance_name,volume_name, etc. let you filter per object. iopsandbandwidth_bytes_per_secondare pre-derived per-second values — aggregate withsum/avg by (...), neverrate().
Examples:
# Total read IOPS across all volumes for the selected array
sum by (volume_name) (powerstore_volume_read_iops{array=~"$array"})

# Appliance efficiency over time
powerstore_appliance_efficiency_ratio{array=~"$array", appliance_name=~"$appliance"}

# File system fill rate
100 * powerstore_file_system_size_used_bytes{array=~"$array"}
    / powerstore_file_system_size_total_bytes{array=~"$array"}

# Busiest volumes by total IOPS
topk(10, sum by (volume_name) (powerstore_volume_total_iops{array=~"$array"}))
Panel conventions
These rules are enforced by go test ./internal/dashboards/ and therefore by make ci.
See ADR-0016.
Group by array on fleet/cluster rollup panels. Every panel that aggregates a
cluster- or appliance-wide value across arrays carries a by (...) clause including array,
and legends as {{array}}. A bare avg(...) or sum(...) blends every selected array into
one unattributable number. Entity-scoped panels group by their entity instead
(sum by (volume_name), by (appliance_name), …); those do not carry array, so two arrays
sharing an entity name would merge — a tracked follow-up, not a per-array-panel concern
(see ADR-0016).
Never let a healthy array vanish. powerstore_drive_state and
powerstore_replication_session_state are info series whose value is always 1; a healthy
array matches no series and its tile disappears. Zero-fill with powerstore_up, whose only
label is array:
sum by (array) (powerstore_drive_state{array=~"$array",state!="Healthy"})
  or sum by (array) (powerstore_up{array=~"$array"} * 0)
For numeric comparisons use the bool modifier instead, which keeps the series:
powerstore_alert_active already emits a stable zero series per known severity and needs
neither treatment.
Hue is identity, line style is direction. Timeseries panels set
"color": {"mode": "palette-classic-by-name"}. Hue is derived deterministically from each
series' name, so within any panel every array or appliance is distinguishable and its colour
is stable across refreshes — but the hash includes the read/write suffix and legends
differ between panels, so the same entity is not guaranteed the same hue on a different panel
or dashboard. Direction is shown by line style — read solid, write dashed via a / write$/
override setting custom.lineStyle. Panels whose colour encodes a threshold rather than an
identity — CPU utilisation, drive wear, the capacity gauges — keep
"color": {"mode": "thresholds"}.
Building more
The dashboards follow the metric naming scheme; new panels can be built
mechanically from it. Remember that all values use explicit units:
_bandwidth_bytes_per_second, _latency_microseconds, _bytes.
Node Exporter Full (Grafana 1860)
This repo bundles the community Node Exporter Full
dashboard (node-exporter-full.json, auto-provisioned). It visualizes host OS metrics
(CPU, memory, disk, network) exposed by prom/node-exporter —
not this exporter's own metrics.
node_exporter is not part of this demo stack: it belongs on the hosts you actually want to
monitor, not bolted onto the exporter's compose. To use this dashboard, run prom/node-exporter
on those hosts and add a node-exporter scrape job to your Prometheus; the dashboard then
visualizes them.