Dashboards
Four ready-made Grafana dashboards ship in the repo under
grafana/provisioning/dashboards/json/PowerScale/, and provision into a PowerScale
folder:
| Dashboard | uid | Focus |
|---|---|---|
| OneFS Overview | powerscale-overview |
Capacity, performance, protocols — day-to-day health. |
| OneFS Advanced | powerscale-advanced |
Node/drive health, data protection, cache efficiency, quota & CPU detail. |
| OneFS Capacity & SLA | powerscale-capacity-sla |
Availability/latency SLIs and capacity headroom with a days-to-full forecast. |
| OneFS Workloads | powerscale-workloads |
Per-workload operations, throughput and CPU. Requires a configured OneFS performance dataset. |
Because the powerscale_ prefix matches
dell/csm-metrics-powerscale, existing
CSM dashboards also work against this exporter without modification.
Every panel carries a description (hover the ⓘ); provisional panels note that their stat keys are not yet live-validated against OneFS.
Folders
Each directory under json/ becomes a Grafana folder
(foldersFromFilesStructure: true in dashboards.yml), so boards arrive filed instead of
piled into General:
json/
├── PowerScale/       → folder "PowerScale"     — the four boards below
└── Infrastructure/   → folder "Infrastructure" — third-party boards (Node Exporter Full)
Adding a board is a copy into the right directory; no config change. A file left directly
in json/ lands in General, which is the signal that it needs a home.
Navigation
The boards are cross-linked, so you move between them without losing context.
Between boards. Every PowerScale board carries a PowerScale dashboards dropdown in
its top-right corner, listing the others. It is driven by the powerscale tag rather than
a hardcoded list, so a new tagged board joins every menu automatically. includeVars and
keepTime are set, so the selected time range and any template variable the destination
board also defines (cluster, and node where present) carry over; a variable the target
board does not declare is simply dropped.
Into node detail. The per-node panels on Overview (CPU Idle, Memory Used, Disk IOPS, Used Capacity) and on Capacity & SLA (Per-Node Used Capacity) carry a data link — click a series and pick Inspect node N in OneFS Advanced to land on the node-detail board scoped to that node:
/d/powerscale-advanced?var-cluster=${__field.labels.cluster}&var-node=${__field.labels.node}&${__url_time_range}
The link targets the uid only, with no title slug, so renaming a board never breaks it.
Overview dashboard
One comprehensive board with these rows (in display order):
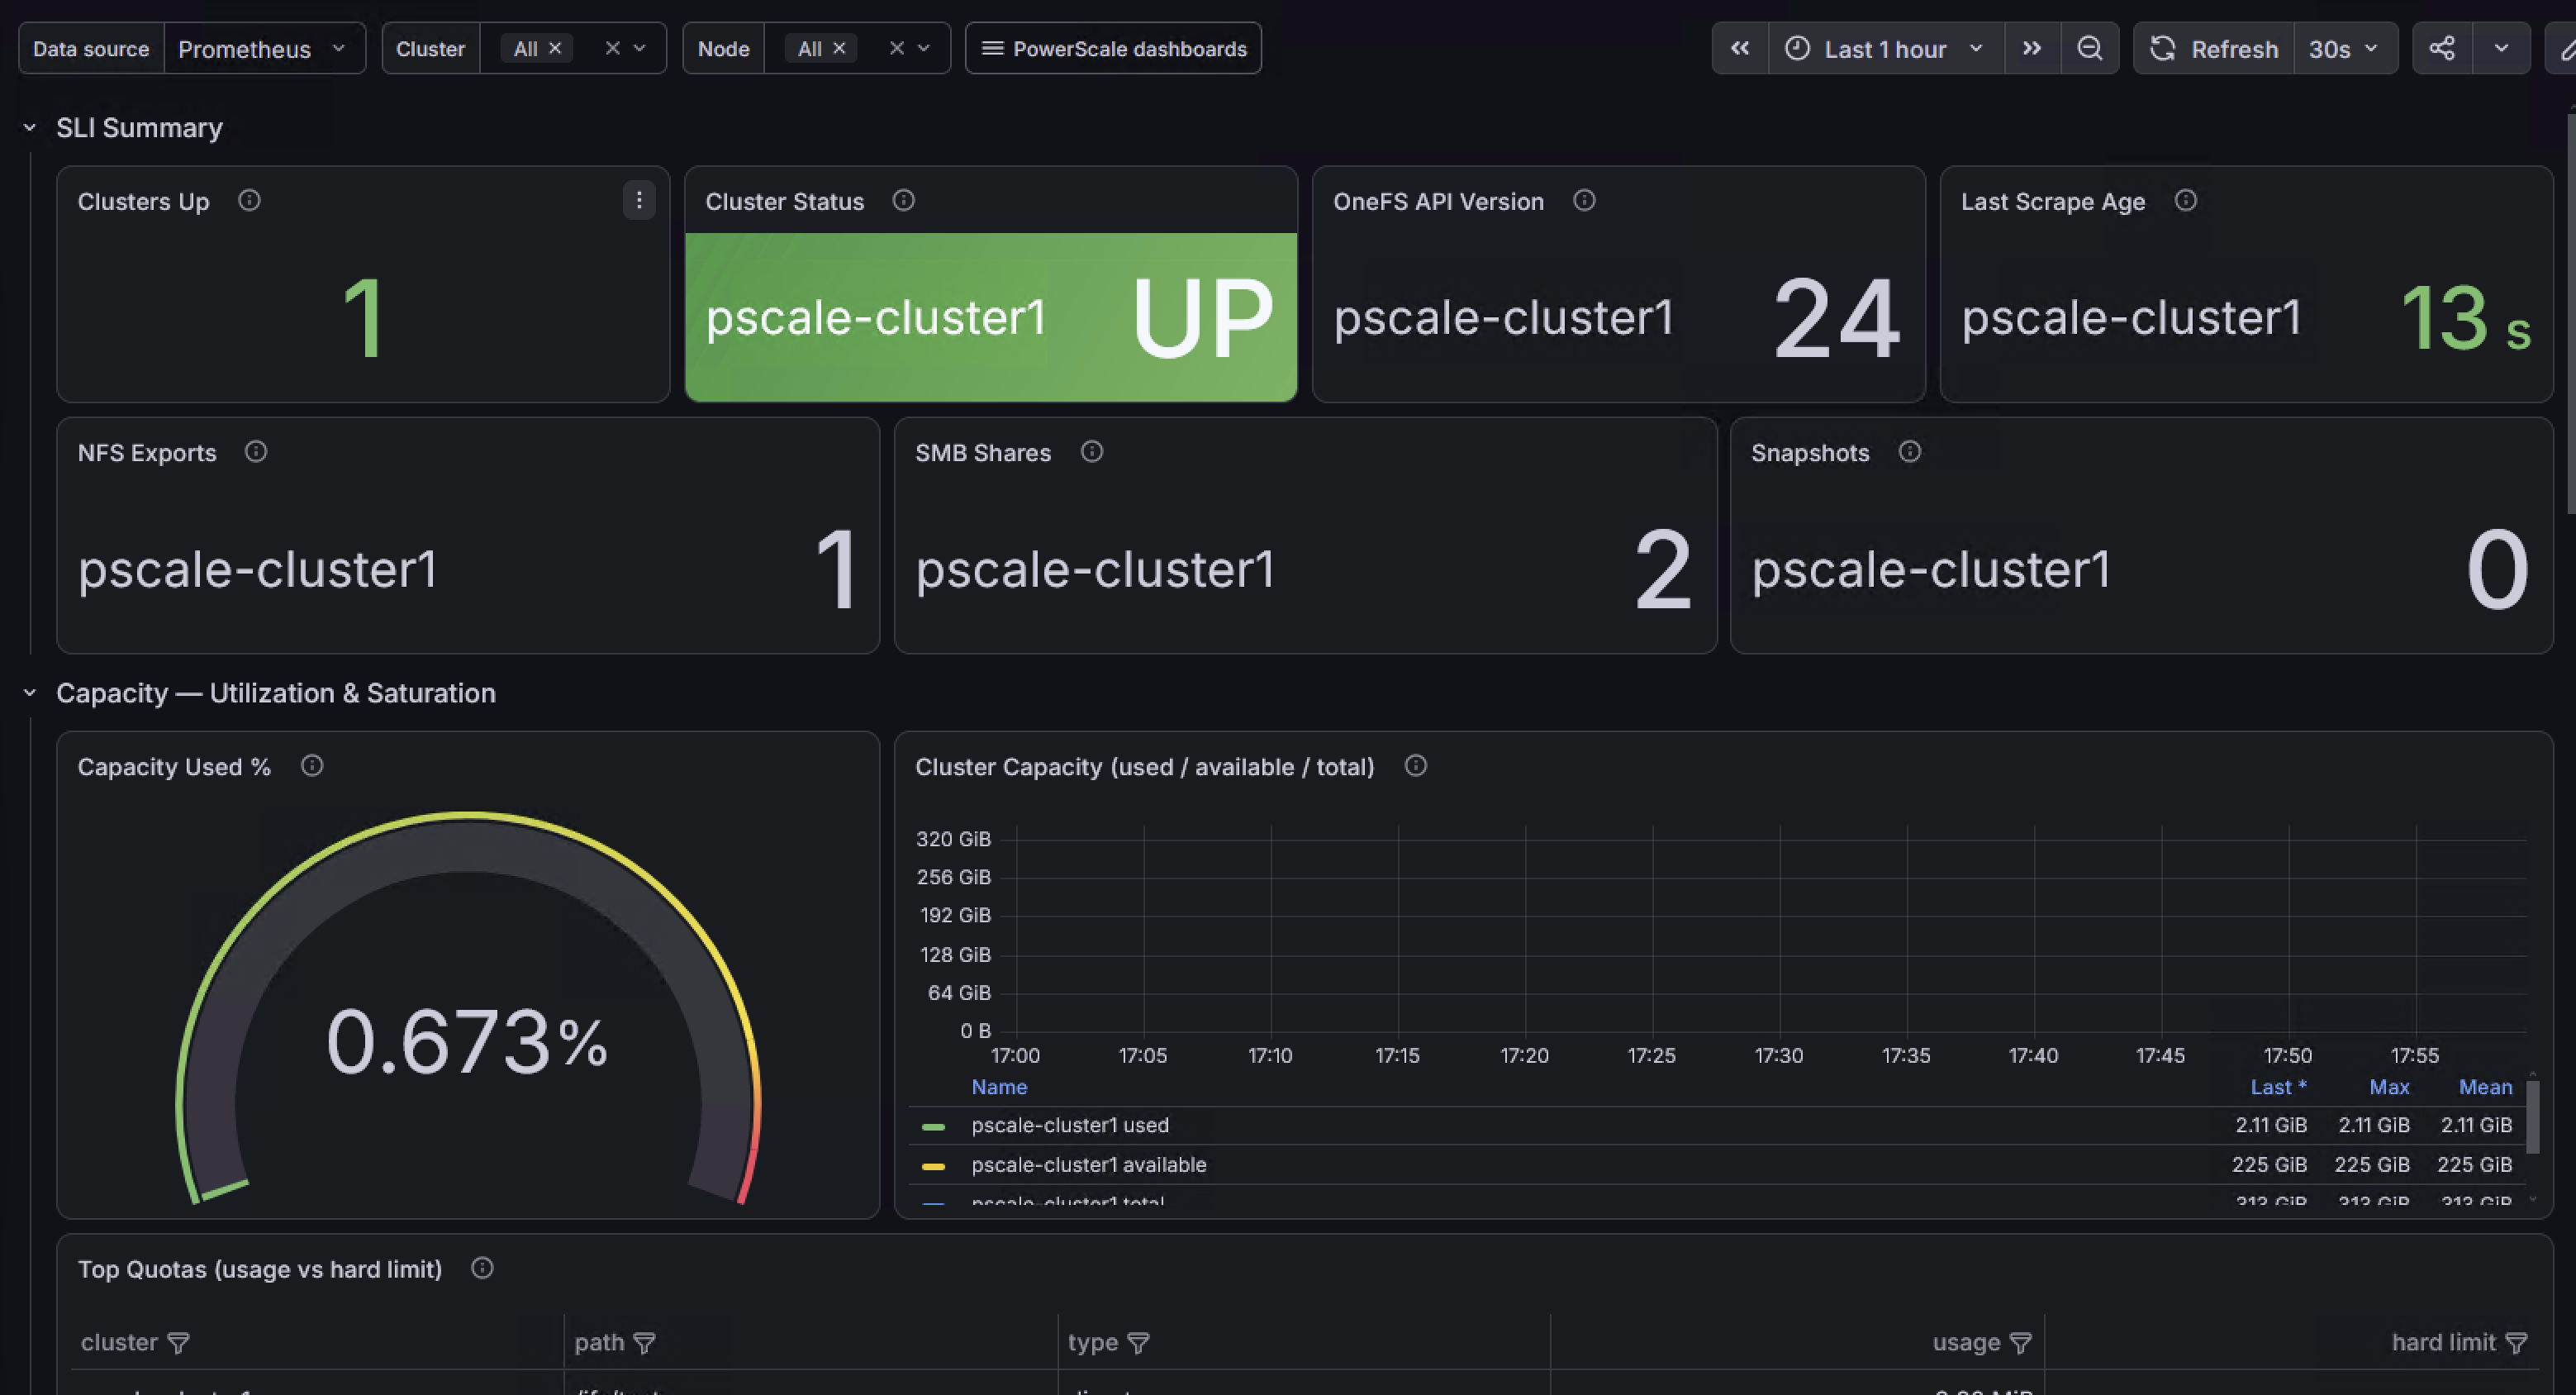
- SLI Summary — clusters up, per-cluster up/down status, detected OneFS API version, last-scrape age, and NFS export / SMB share / snapshot counts.
- Capacity — Utilization & Saturation — capacity used %, a used/available/free/total timeseries, and a table of the top quotas (usage vs hard limit).
- Compute — Utilization — cluster system / user / idle percent.
- Network & Disk — Utilization — external in/out throughput and cluster disk IOPS.
- Protocol — Rate & Duration (RED) — operations and average latency, broken down by
protocolandop. - Per-Node Detail (collapsed by default) — node CPU idle, memory used, disk IOPS, and used capacity.
- Licensing — per-feature license status (colored) and a days-to-expiry table (soonest first; red under 30 days).
Template variables
| Variable | Source |
|---|---|
datasource |
Any Prometheus datasource — so the board works on import, not just in the bundled stack. |
cluster |
label_values(powerscale_up, cluster) — multi-select, includes All. |
node |
label_values(powerscale_node_cpu_idle_percent{cluster=~"$cluster"}, node) — drives the Per-Node Detail row. |
Per-second gauges
IOPS / throughput / protocol panels read per-second gauges directly with sum/avg
— they intentionally do not use rate(). See the Metrics Reference.
Advanced dashboard
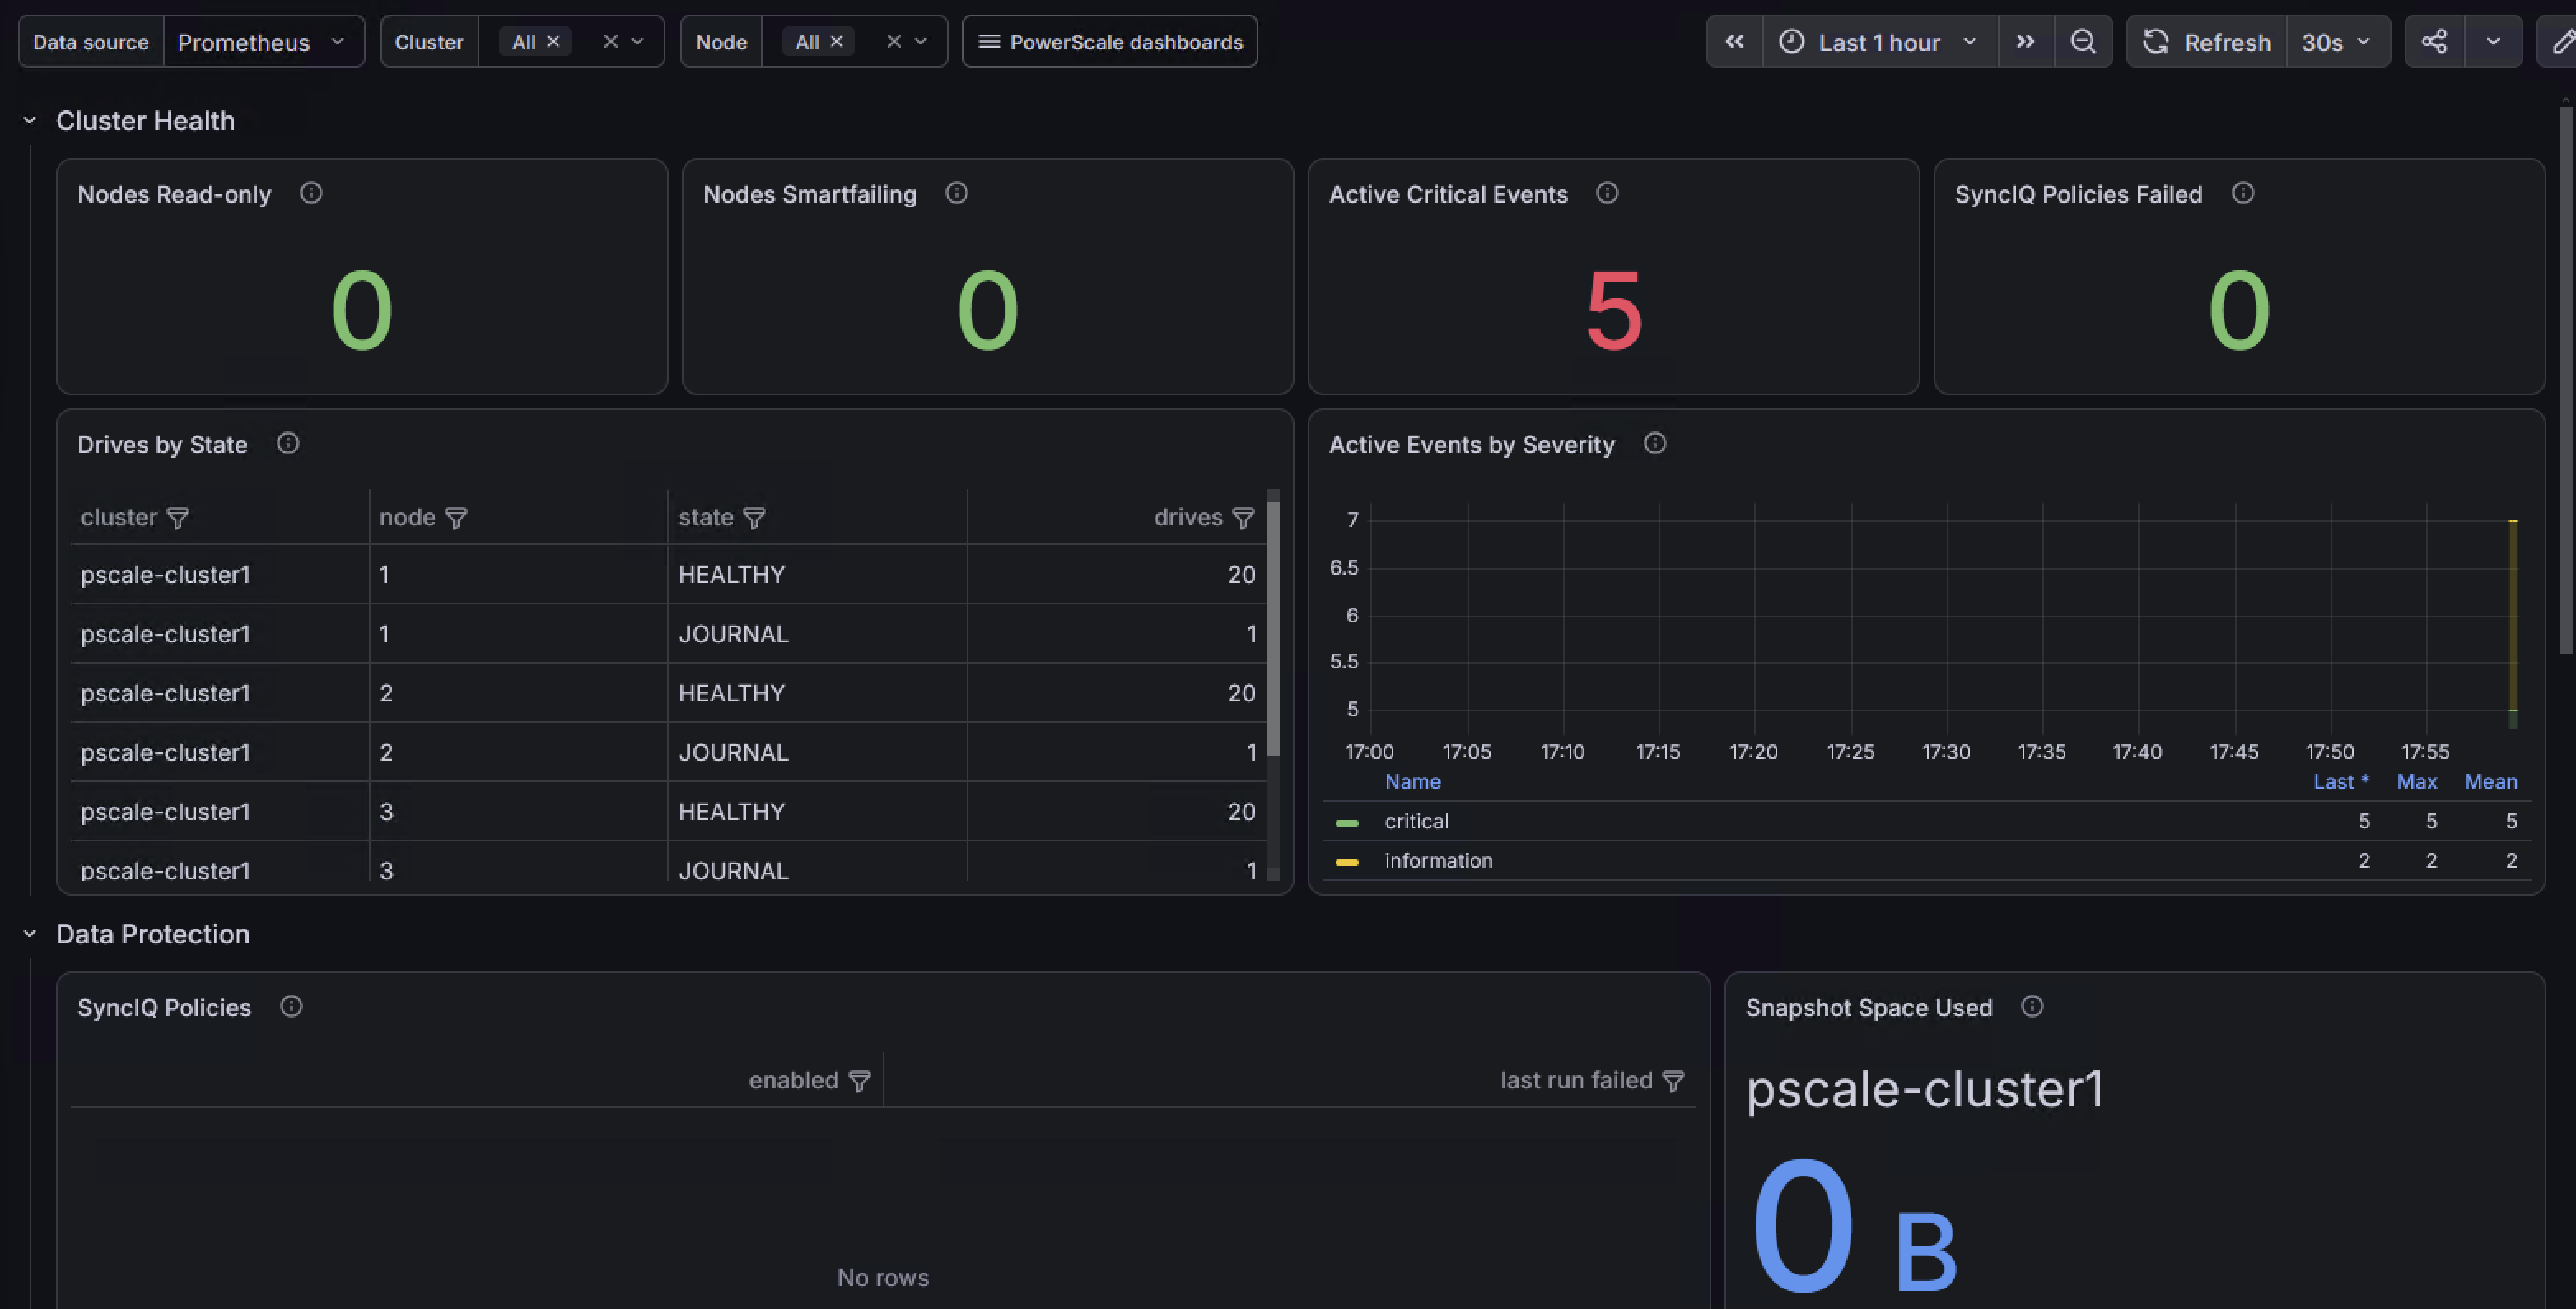
The Advanced board surfaces the health/state and efficiency metrics, with a link back to the Overview board.
Validated rows
- Cluster Health — nodes read-only / smartfailing, drives by state, active events by severity, SyncIQ policies failed.
- Data Protection — SyncIQ policy table (enabled + last-run-failed) and snapshot space used.
- Node CPU Detail — per-node sys / user / idle.
- Quota Detail — logical + physical usage vs advisory / soft / hard thresholds.
Provisional rows (collapsed by default)
The following rows are collapsed by default because their underlying stat keys or schemas were validated against the OneFS 9.14.0 API specification but (except where noted) not yet confirmed against a live cluster.
- Cache Efficiency — L1/L2/L3 read hit-vs-miss and a computed hit-ratio, from the
node-scoped
node.ifs.cache.*keys. Both the key names and their unit semantics (per-second bytes/second rates) are now confirmed against a live cluster via--trace(see Metrics Reference); the row stays collapsed by default alongside the other advanced rows. - Storage Efficiency — deduplication logical saved / deduplicated bytes (provisional).
- Per-Drive — top drive IOPS and busy % (provisional).
- Per-Client — operations by protocol/class and throughput in/out (provisional).
- Hardware — power-supply failures, node temperature and fan speed (provisional).
- OneFS 9.15 — protocol latency by processing stage and top-10 quota data-reduction ratio; panels stay empty on older clusters (provisional).
Capacity & SLA dashboard
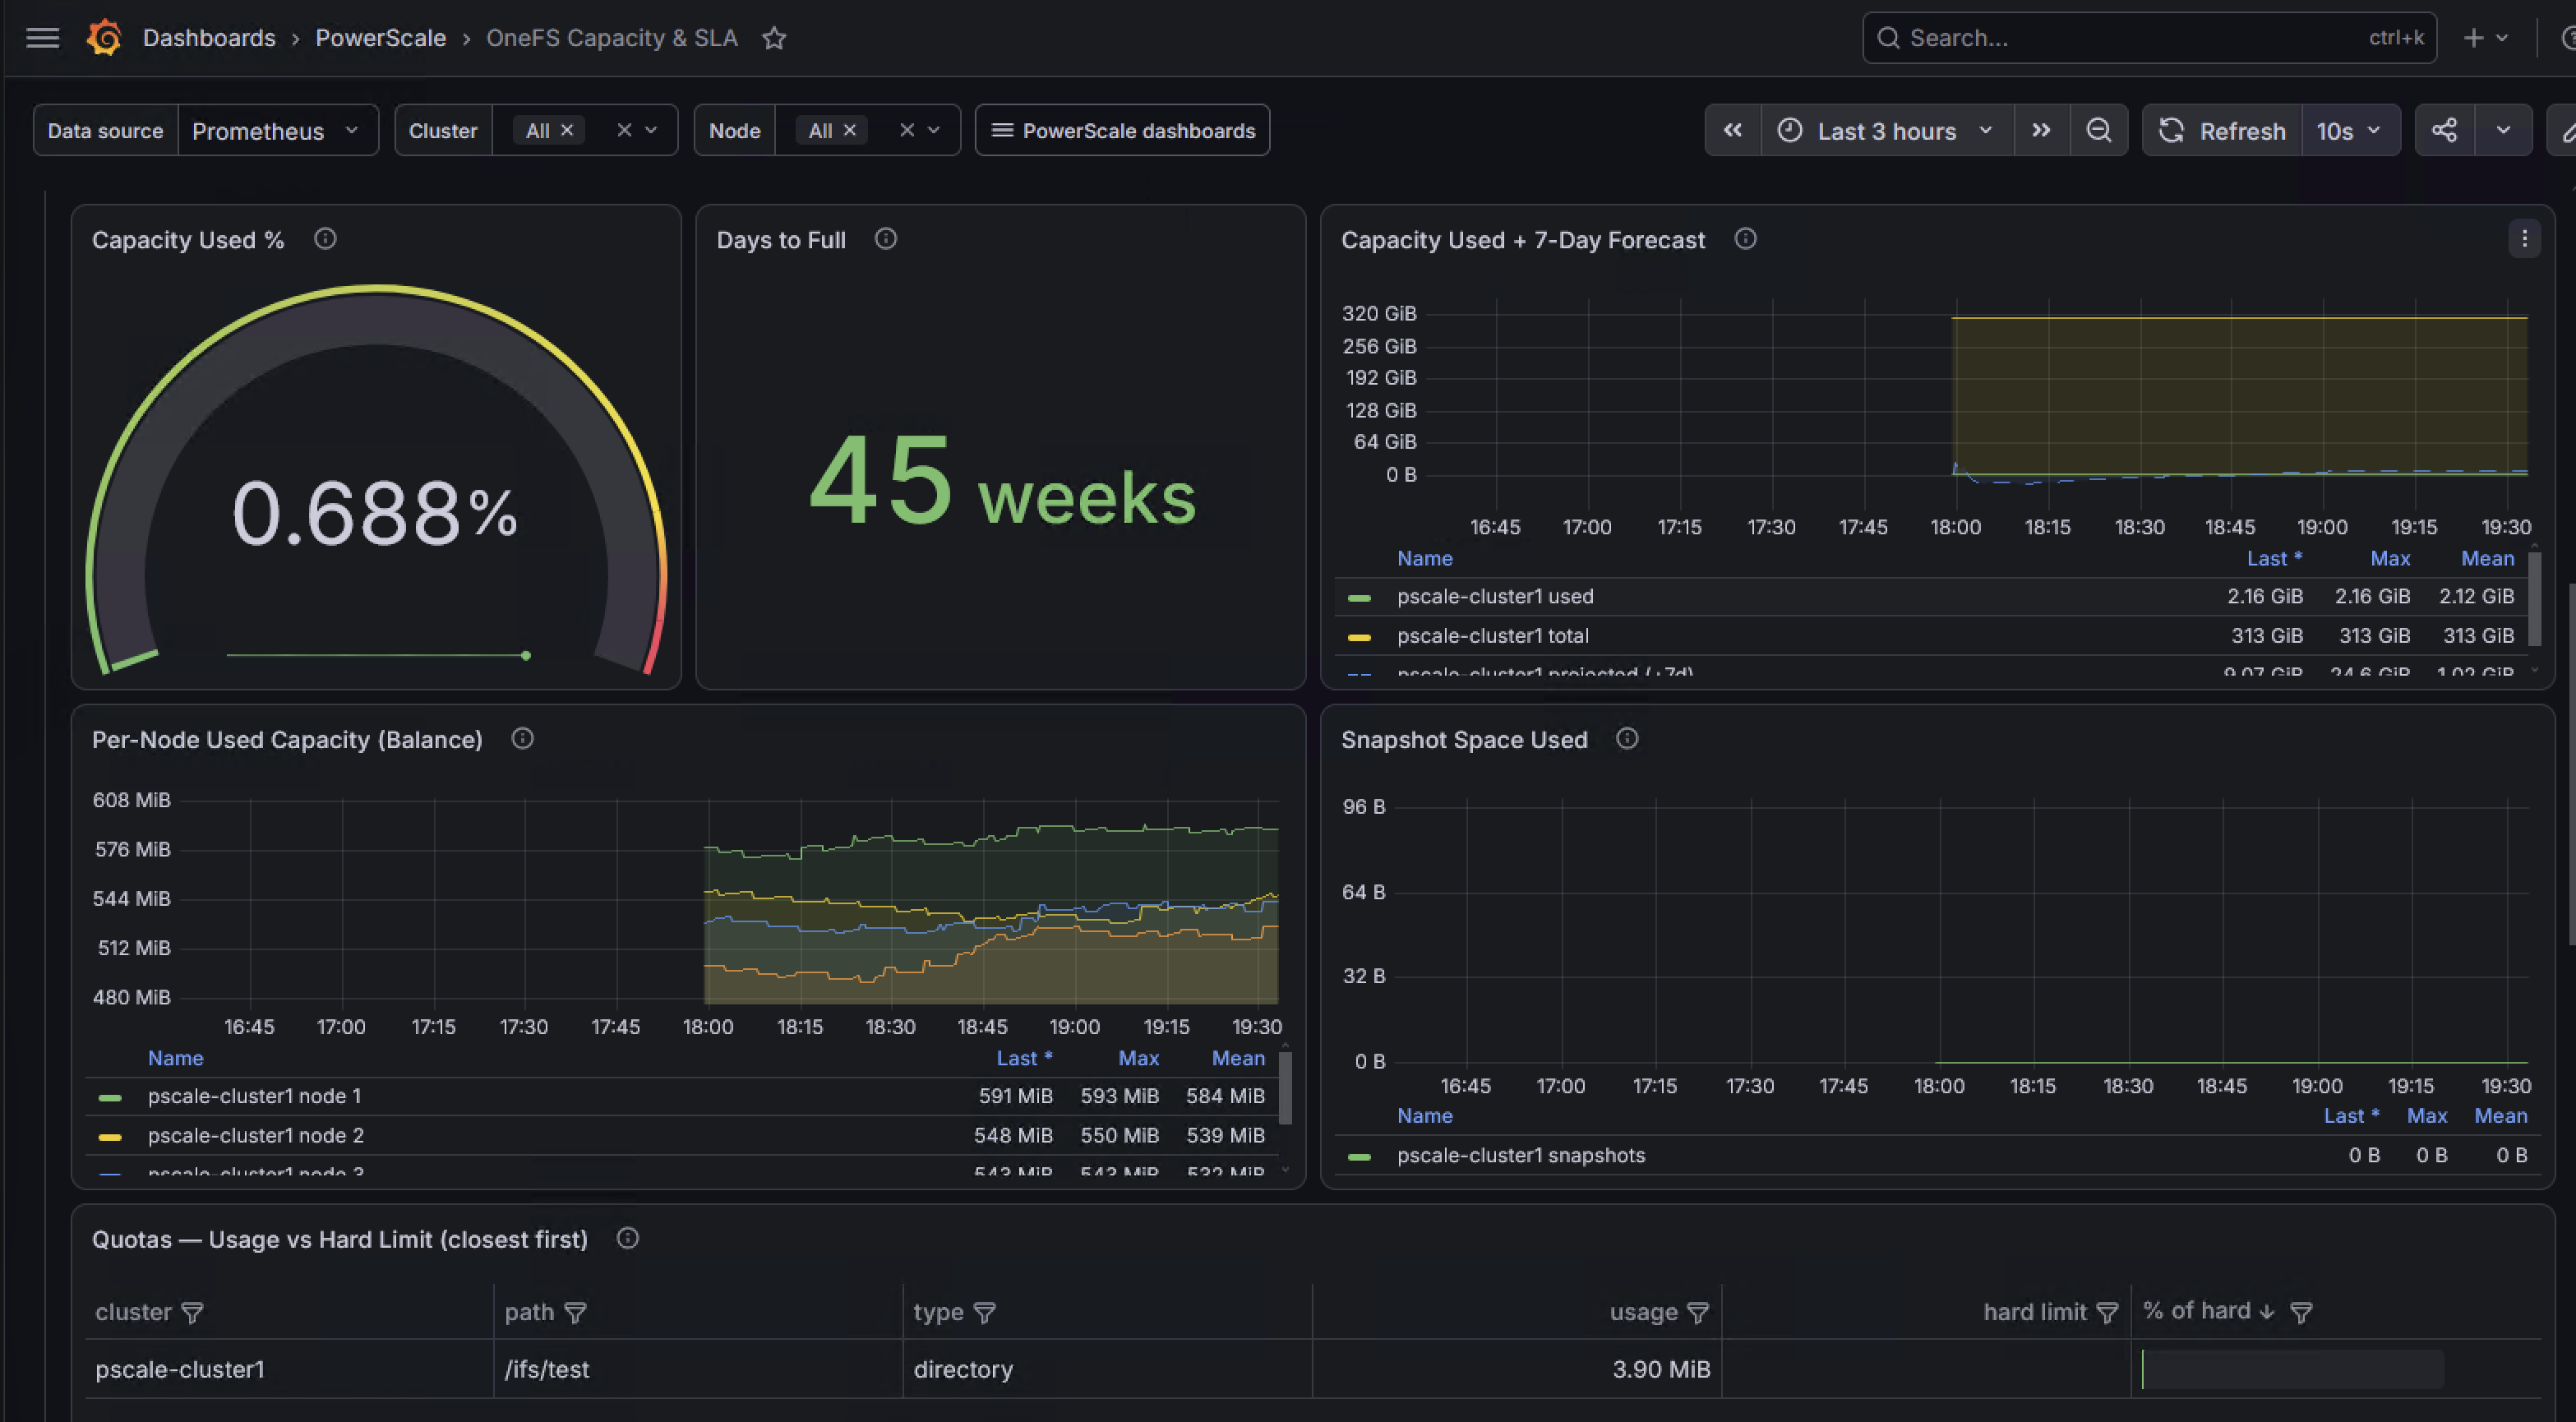
A focused planning board built only on live-validated metrics (no provisional keys), in two sections:
- SLA — Availability & Error Budget — a stat strip (cluster availability %, scrape freshness, nodes read-only / smartfailing, SyncIQ failures, active critical events).
- SLA — Latency, Throughput & Errors (RED) — protocol latency (Duration), protocol operations (Rate), and active events by severity (Errors).
- Capacity — Headroom & Forecast — capacity used % gauge, a Days to Full stat and a
7-day forecast line (both from
predict_linear/derivover the trailing 24h trend), per-node capacity balance, snapshot space, and a quota table ranked by closeness to the hard limit. - Storage Pools — Capacity — per node-pool/tier table (used %, used/total/available, and the SSD vs HDD media split), a node-pool used-% trend, and SSD-vs-HDD available capacity. The list holds both node pools and tiers; filter
type="nodepool"for a non-overlapping cluster total. - Licensing — min days to license expiry and a count of expired licenses.
Forecast is a trend projection
Days-to-full and the +7d line extrapolate the trailing 24h growth rate; a flat or
shrinking trend reads as effectively "never". Use a longer dashboard time range
(default now-7d) so the projection has history to draw from.
Workloads dashboard
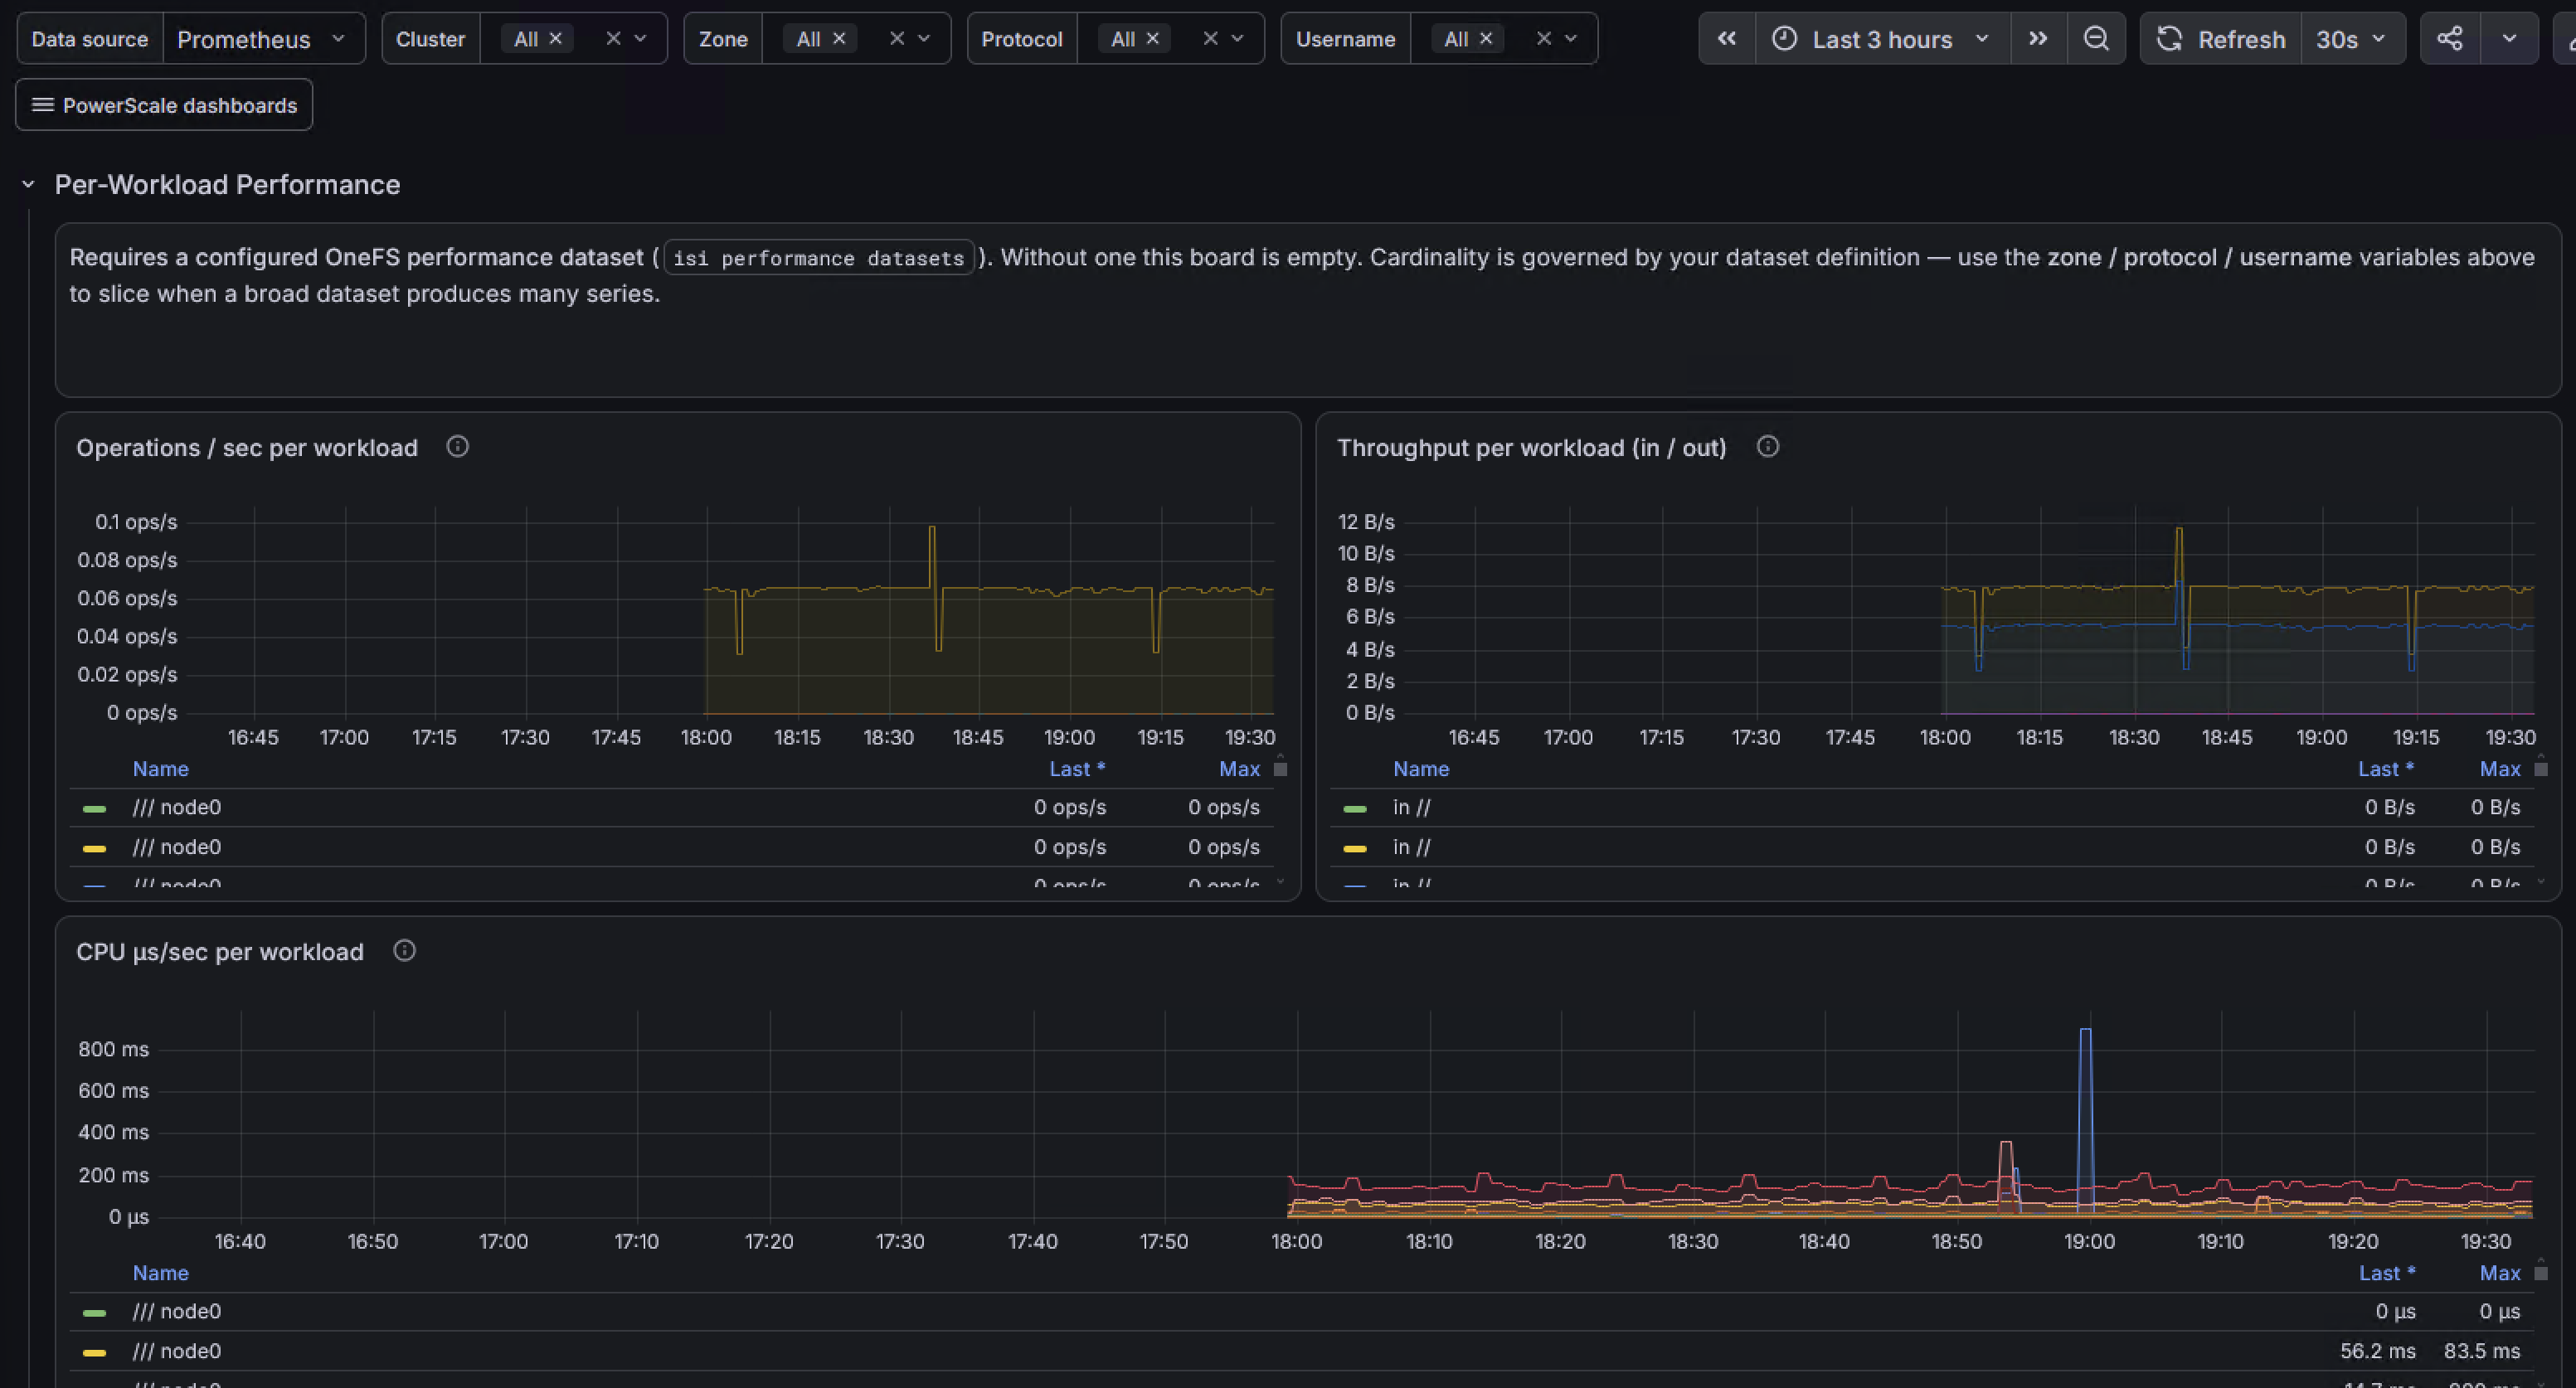
Per-workload performance from OneFS statistics summaries (uid powerscale-workloads):
- Operations/sec, Throughput (in/out), and CPU µs/sec timeseries, one series per workload, plus a Workload Snapshot table (instant, sorted by ops/sec).
- Template variables cluster / zone / protocol / username slice the view — use them to bound the series count on a broad dataset.
Requires a performance dataset
Workload rows are produced only when a OneFS performance dataset is configured
(isi performance datasets). Without one, this board is empty — every other dashboard is
unaffected. Cardinality is governed by your dataset definition; the exporter exposes a
fixed label set (node, zone, protocol, username, system_name, job_type) and
omits the unbounded dimensions (path, IPs, SIDs).
Per-second gauges
Operations, throughput and CPU are per-second gauges — aggregate with sum/avg, never
rate().
Auto-provisioned (compose stack)
The local stack provisions both the Prometheus
datasource and this dashboard. docker-compose.yml mounts ./grafana/provisioning into
Grafana, and grafana/provisioning/dashboards/dashboards.yml loads every JSON under
json/:
PSCALE1_PASSWORD='your-monitor-password' docker compose up -d --build
# Grafana: http://localhost:3000  (admin / admin)
# Dashboards → PowerScale → OneFS Overview
Manual import (existing Grafana)
- Dashboards → New → Import.
- Upload
grafana/provisioning/dashboards/json/PowerScale/powerscale-overview.json(or paste its contents). - Pick your Prometheus datasource when prompted, then Import.
Import all four to keep the cross-board dropdown populated — it lists whichever
powerscale-tagged boards exist in your Grafana, so a partial import yields a partial
menu. Choose a folder at import time; the folder mapping above applies to provisioning
only.
Customising
The provider sets allowUiUpdates: true, so you can tweak panels in the Grafana UI. To
persist changes, export the dashboard JSON (Share → Export → Save to file) and replace
the file in the repo. Keep the uid stable so links and provisioning stay consistent.
Node Exporter Full (Grafana 1860)
This repo bundles the community Node Exporter Full
dashboard (node-exporter-full.json, auto-provisioned). It visualizes host OS metrics
(CPU, memory, disk, network) exposed by prom/node-exporter —
not this exporter's own metrics.
node_exporter is not part of this demo stack: it belongs on the hosts you actually want to
monitor, not bolted onto the exporter's compose. To use this dashboard, run prom/node-exporter
on those hosts and add a node-exporter scrape job to your Prometheus; the dashboard then
visualizes them.