Dashboards
The repository ships Grafana dashboards under grafana/, auto-provisioned by the
Docker Compose quickstart against the Prometheus datasource.
| Dashboard | File | Focus |
|---|---|---|
| iDRAC | grafana/idrac.json |
Detailed per-machine view |
| iDRAC Overview | grafana/idrac_overview.json |
Global overview of all machines |
| Status (alternative) | grafana/status-alternative.json |
Detailed per-machine status |
| PDU | grafana/pdu.json |
Rack PDU power, energy, and health |
The overview and detail dashboards were contributed by @7840vz.
Previews
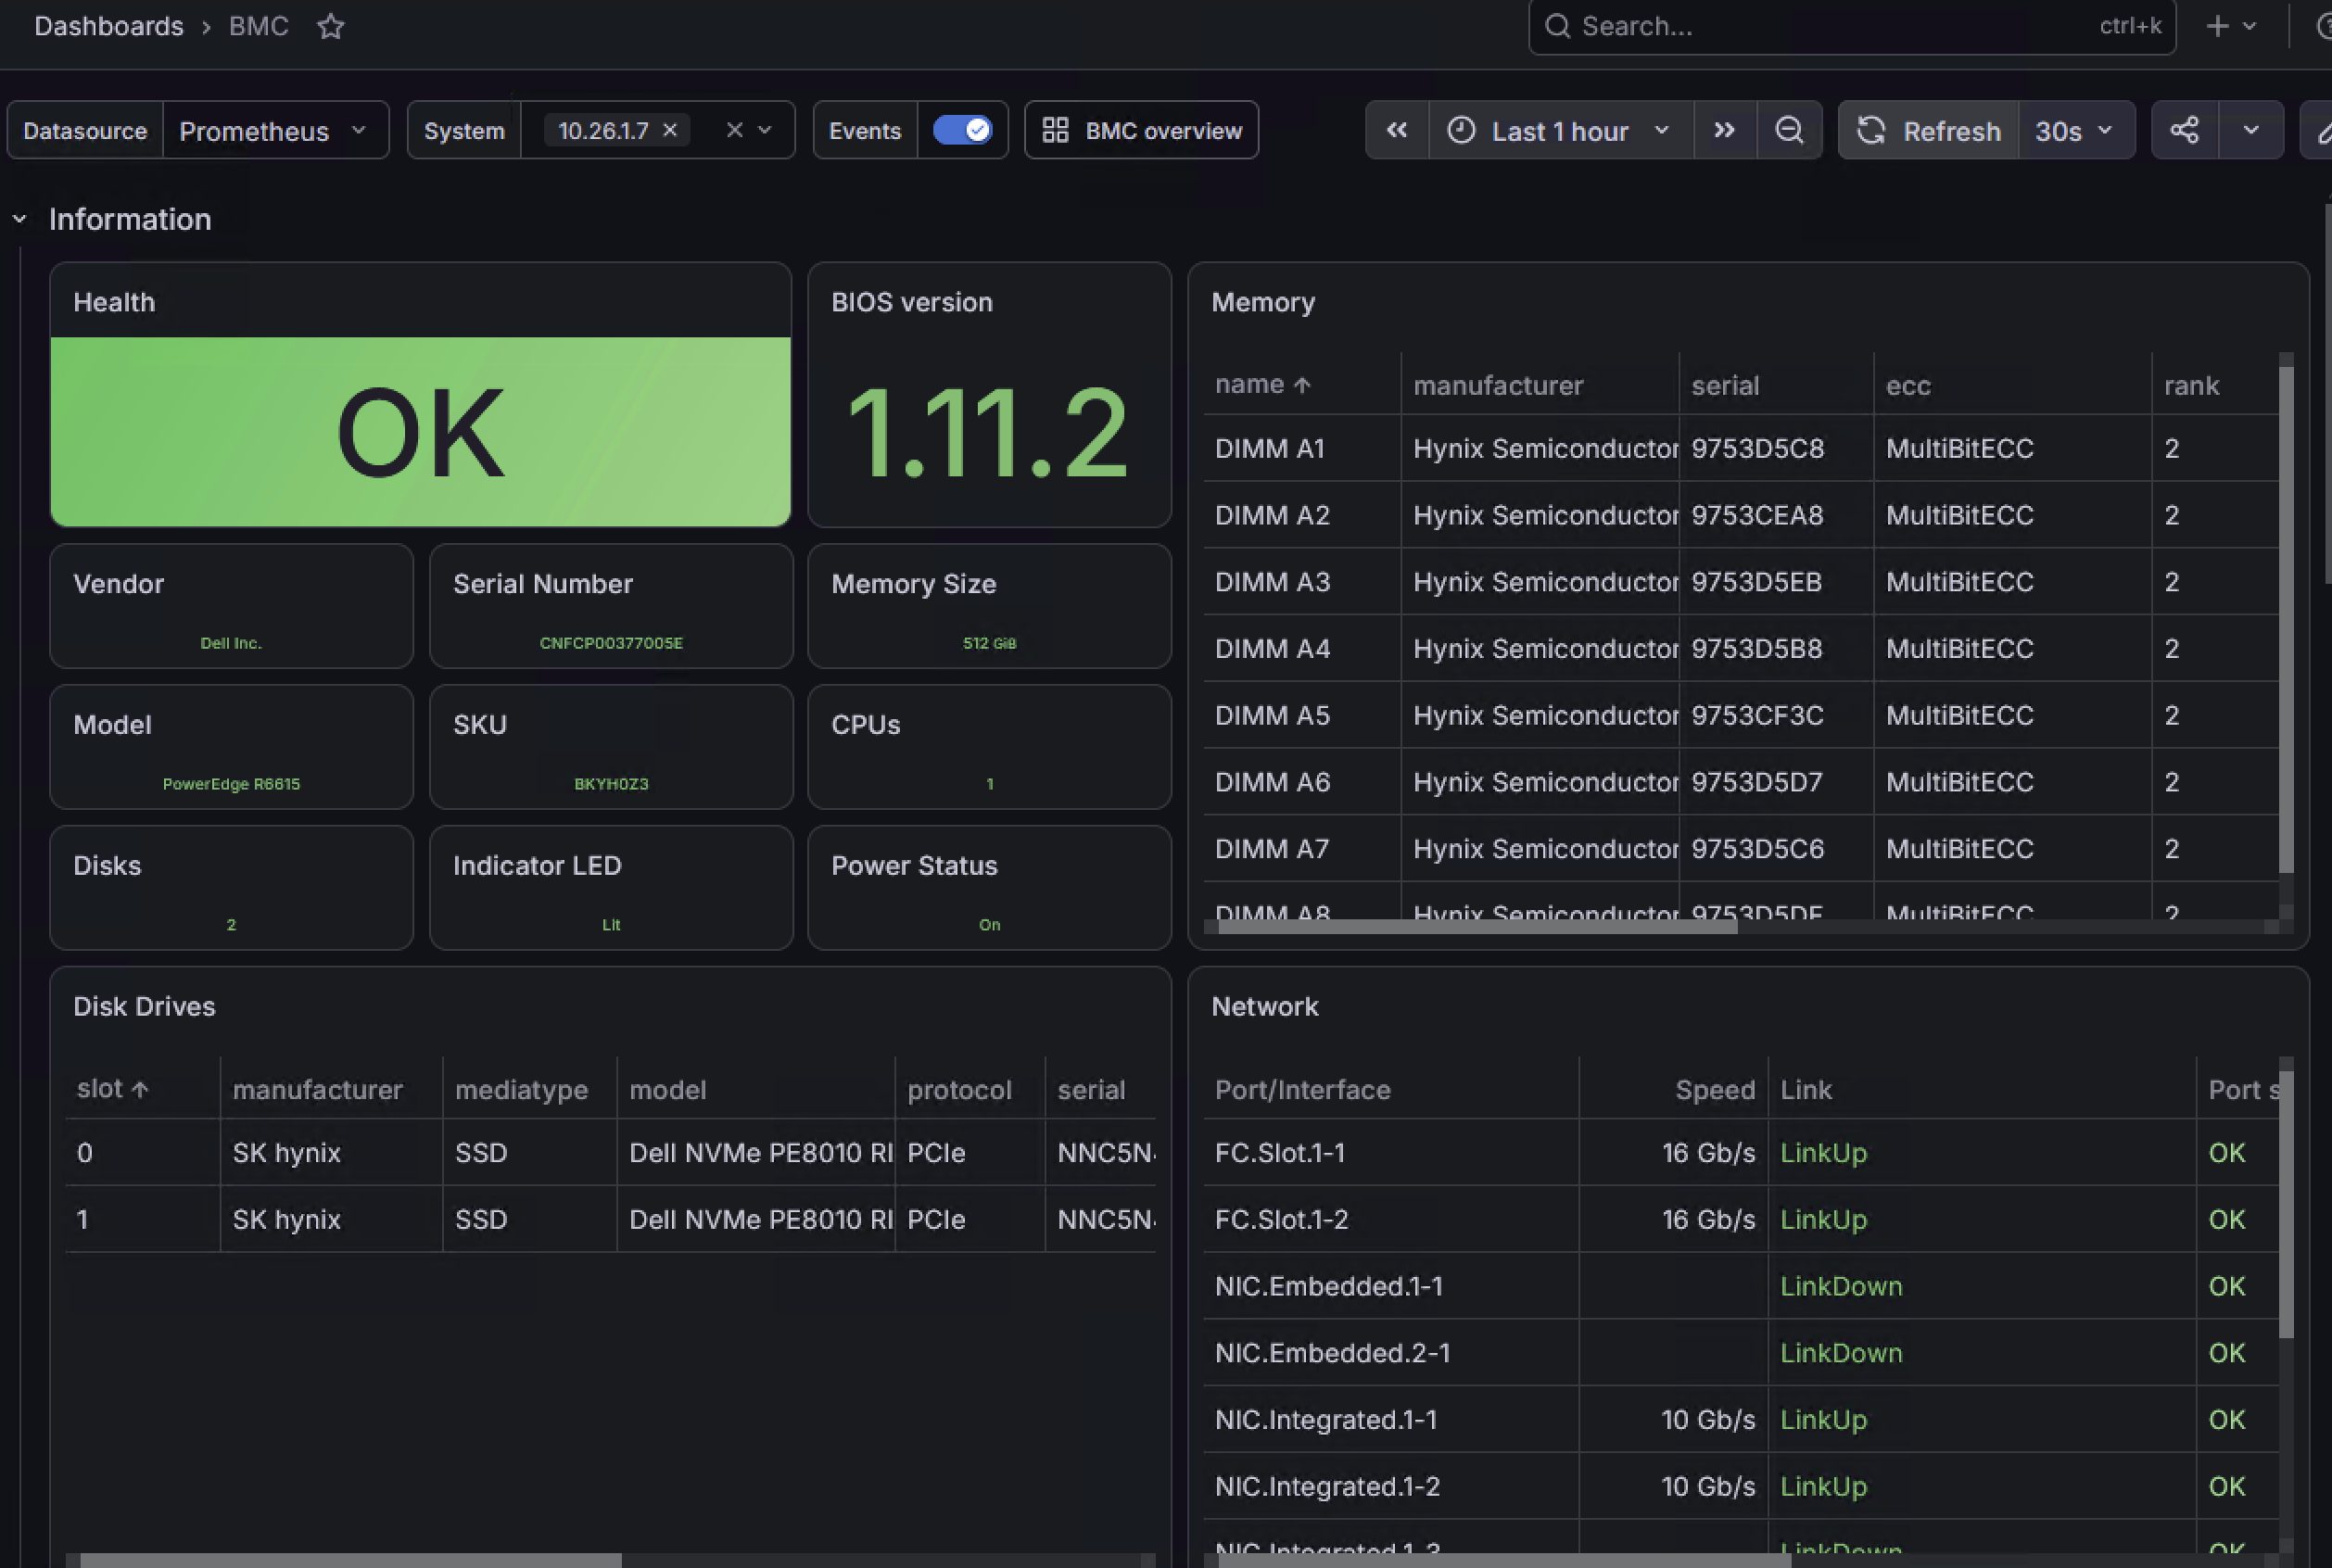
Per-machine detail (grafana/idrac.json) — inventory, memory, disks, and NIC link state:
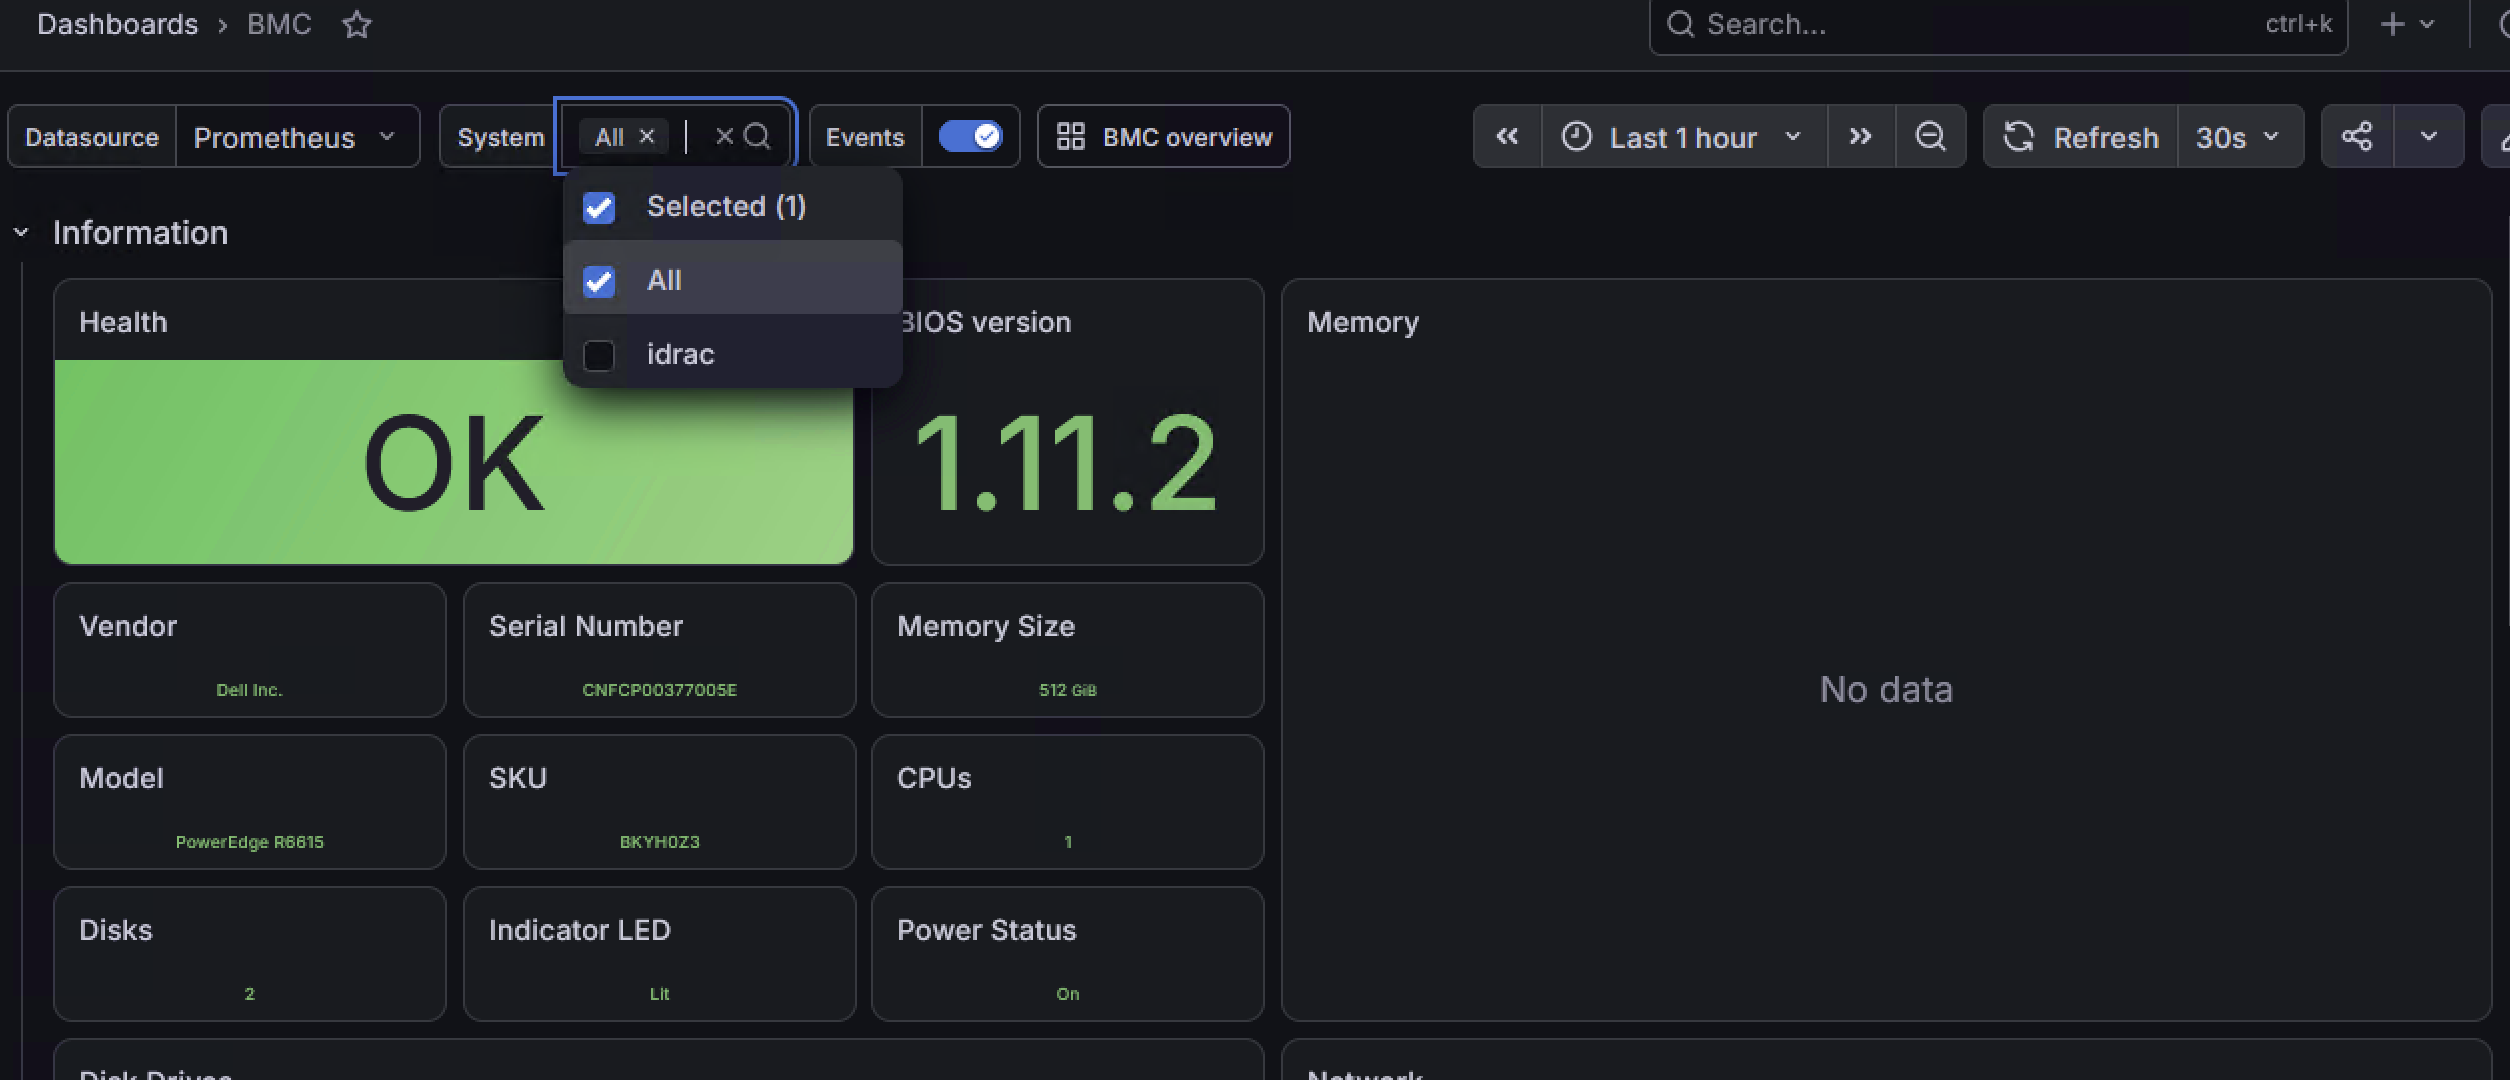
The System template variable picks which machine the detail panels describe:
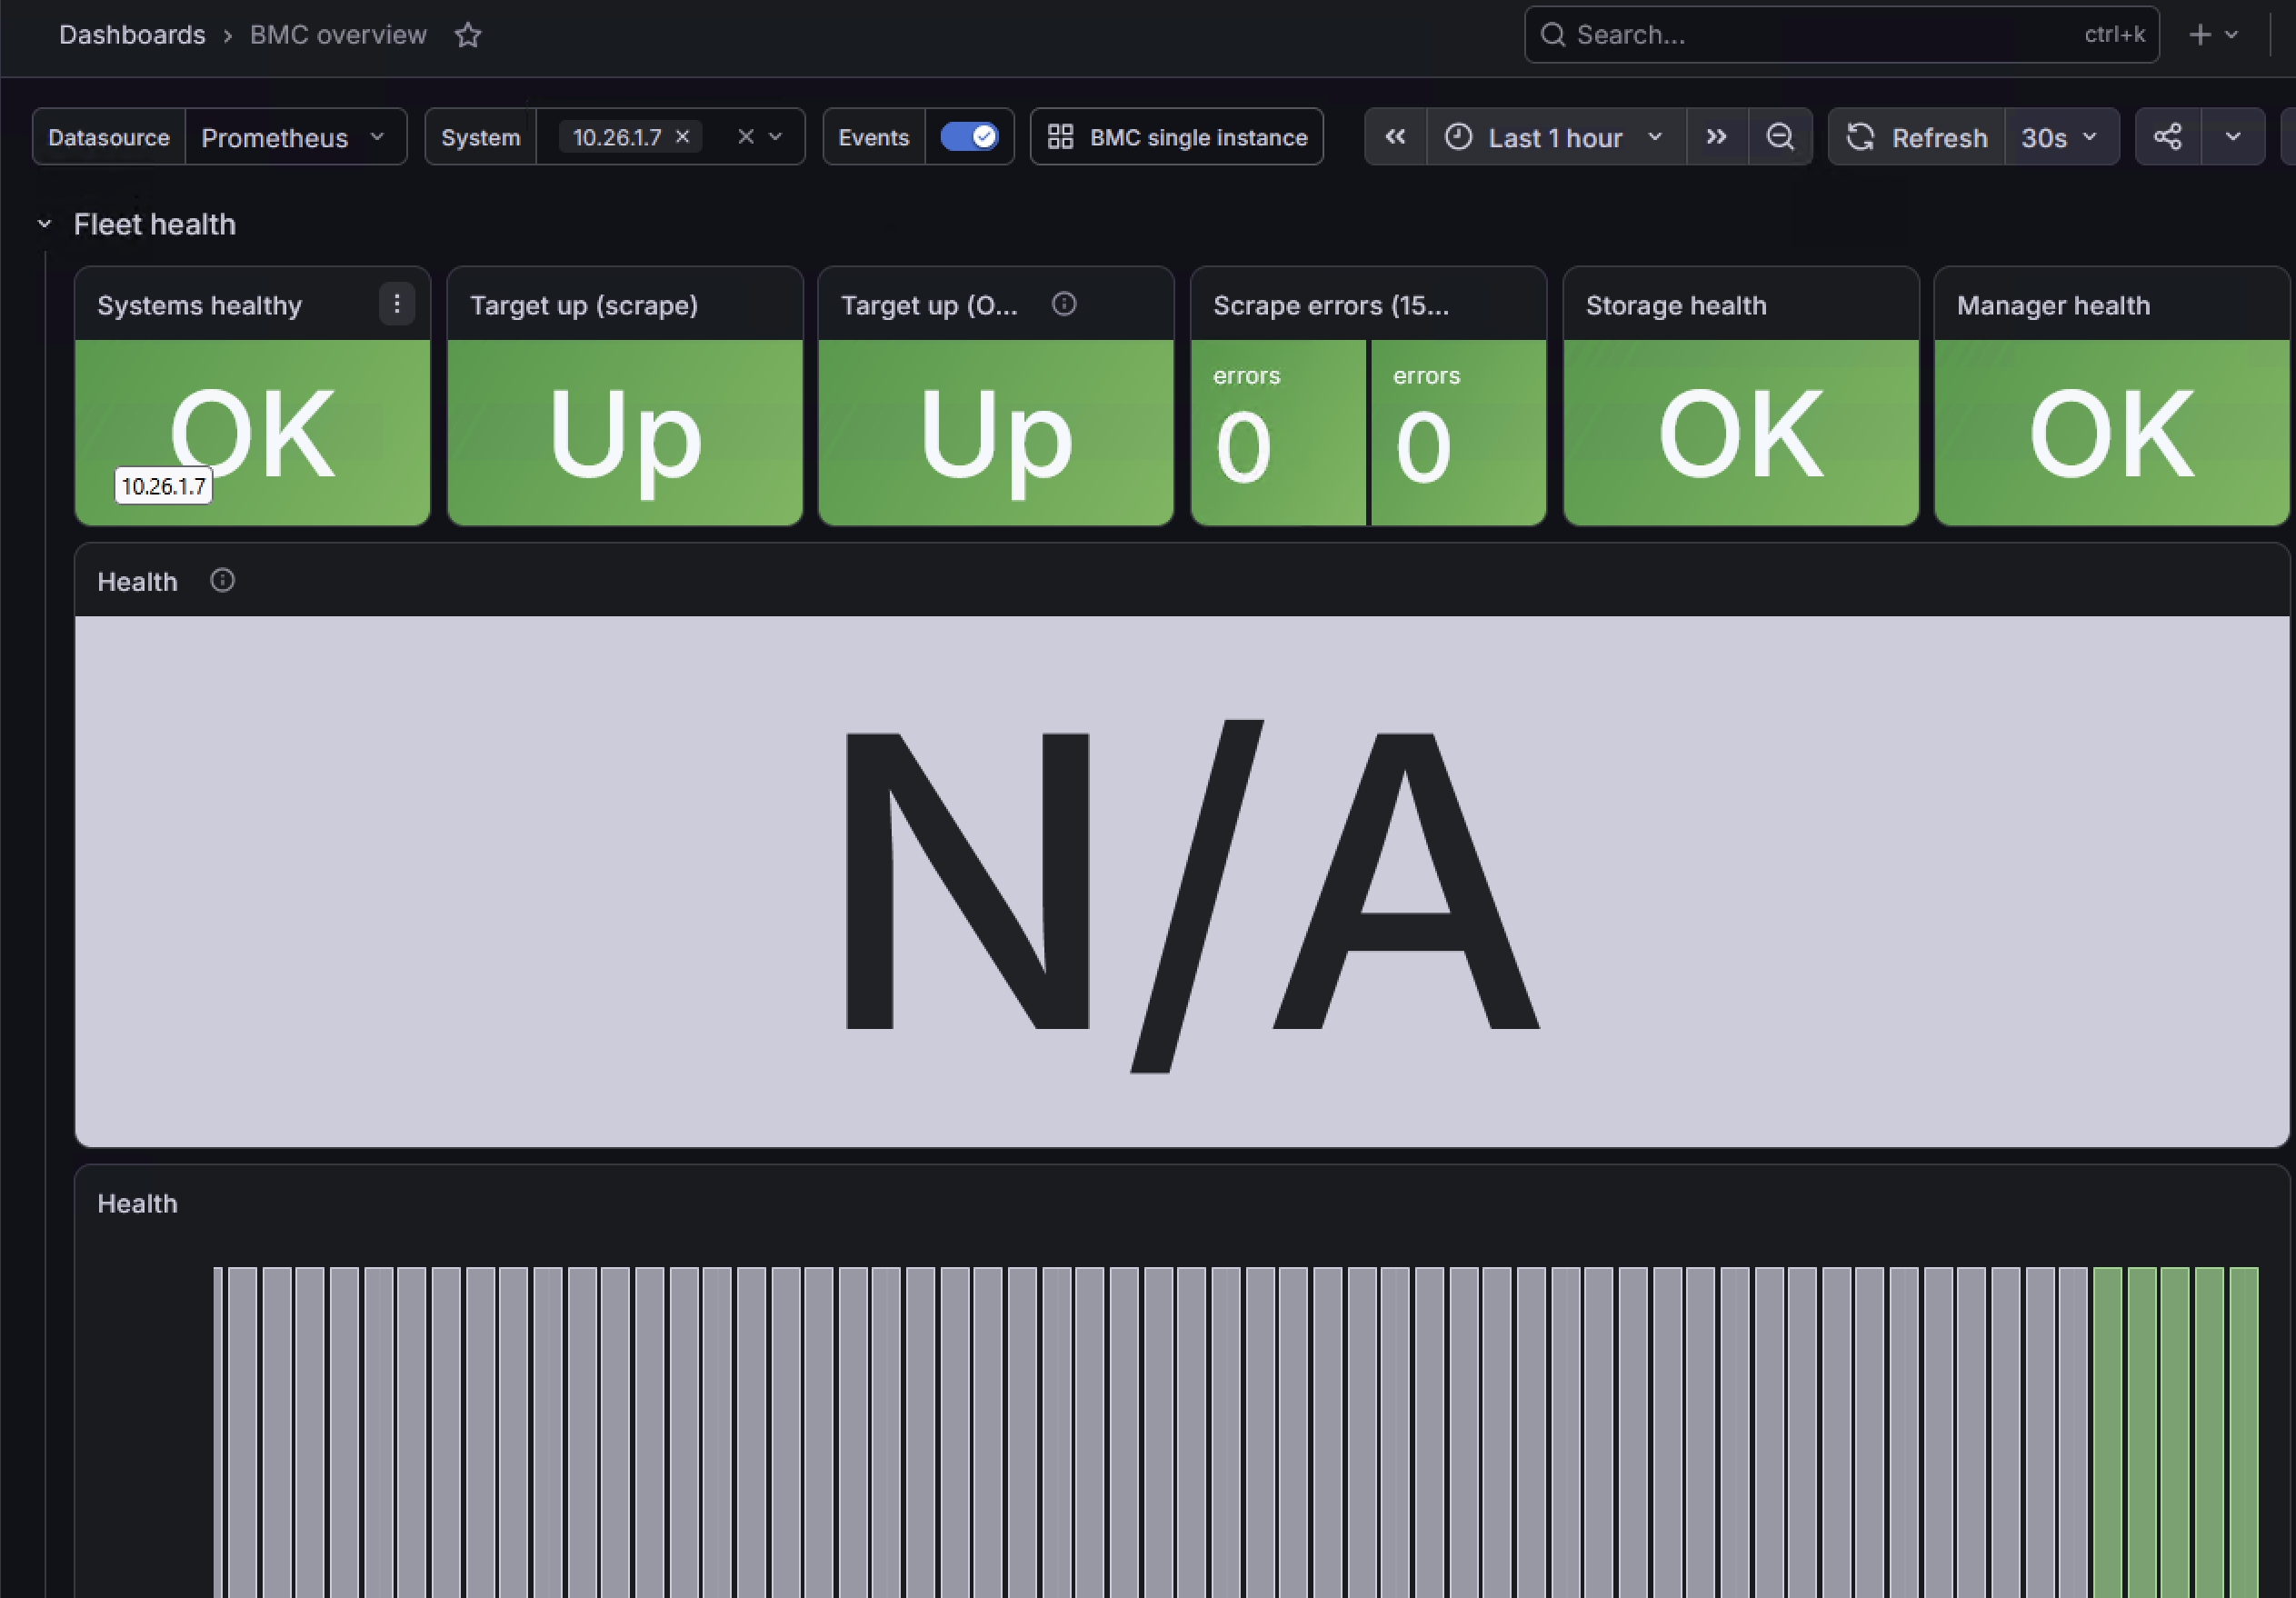
Fleet overview (grafana/idrac_overview.json) — health rollups, scrape-error counts, and
target availability across both export paths:
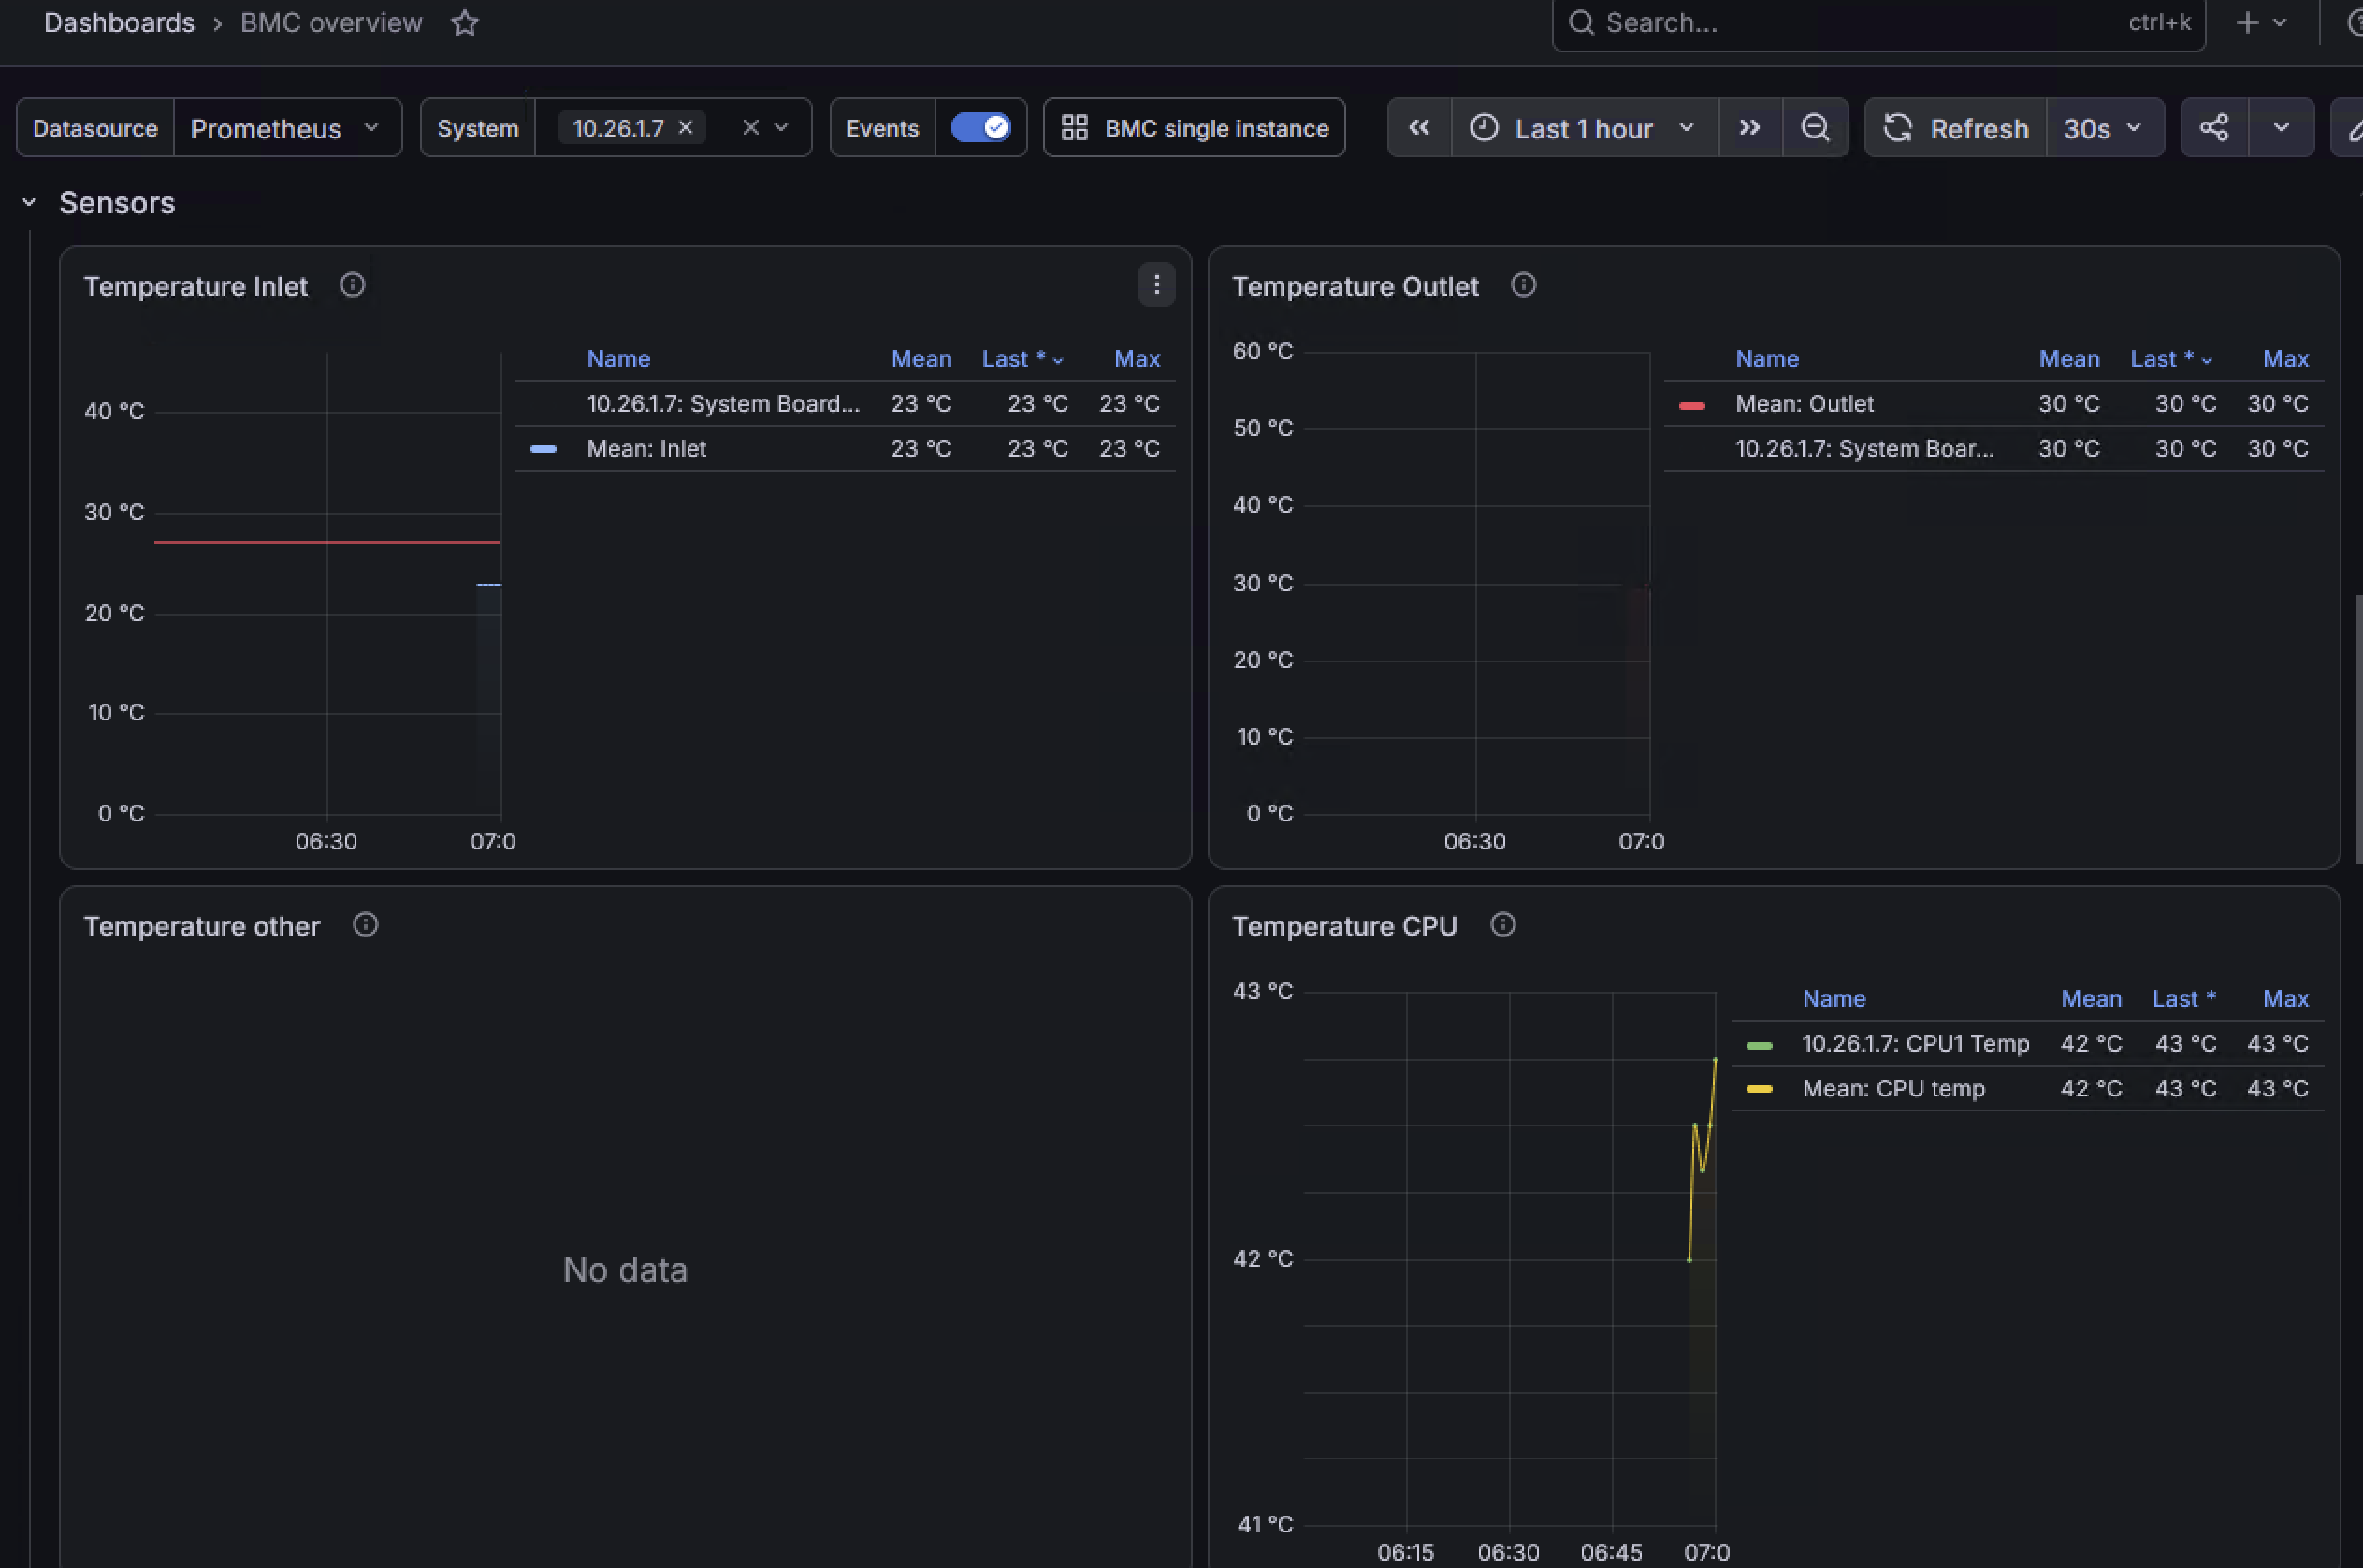
The same dashboard's sensor row breaks temperature out by inlet, outlet, and CPU:
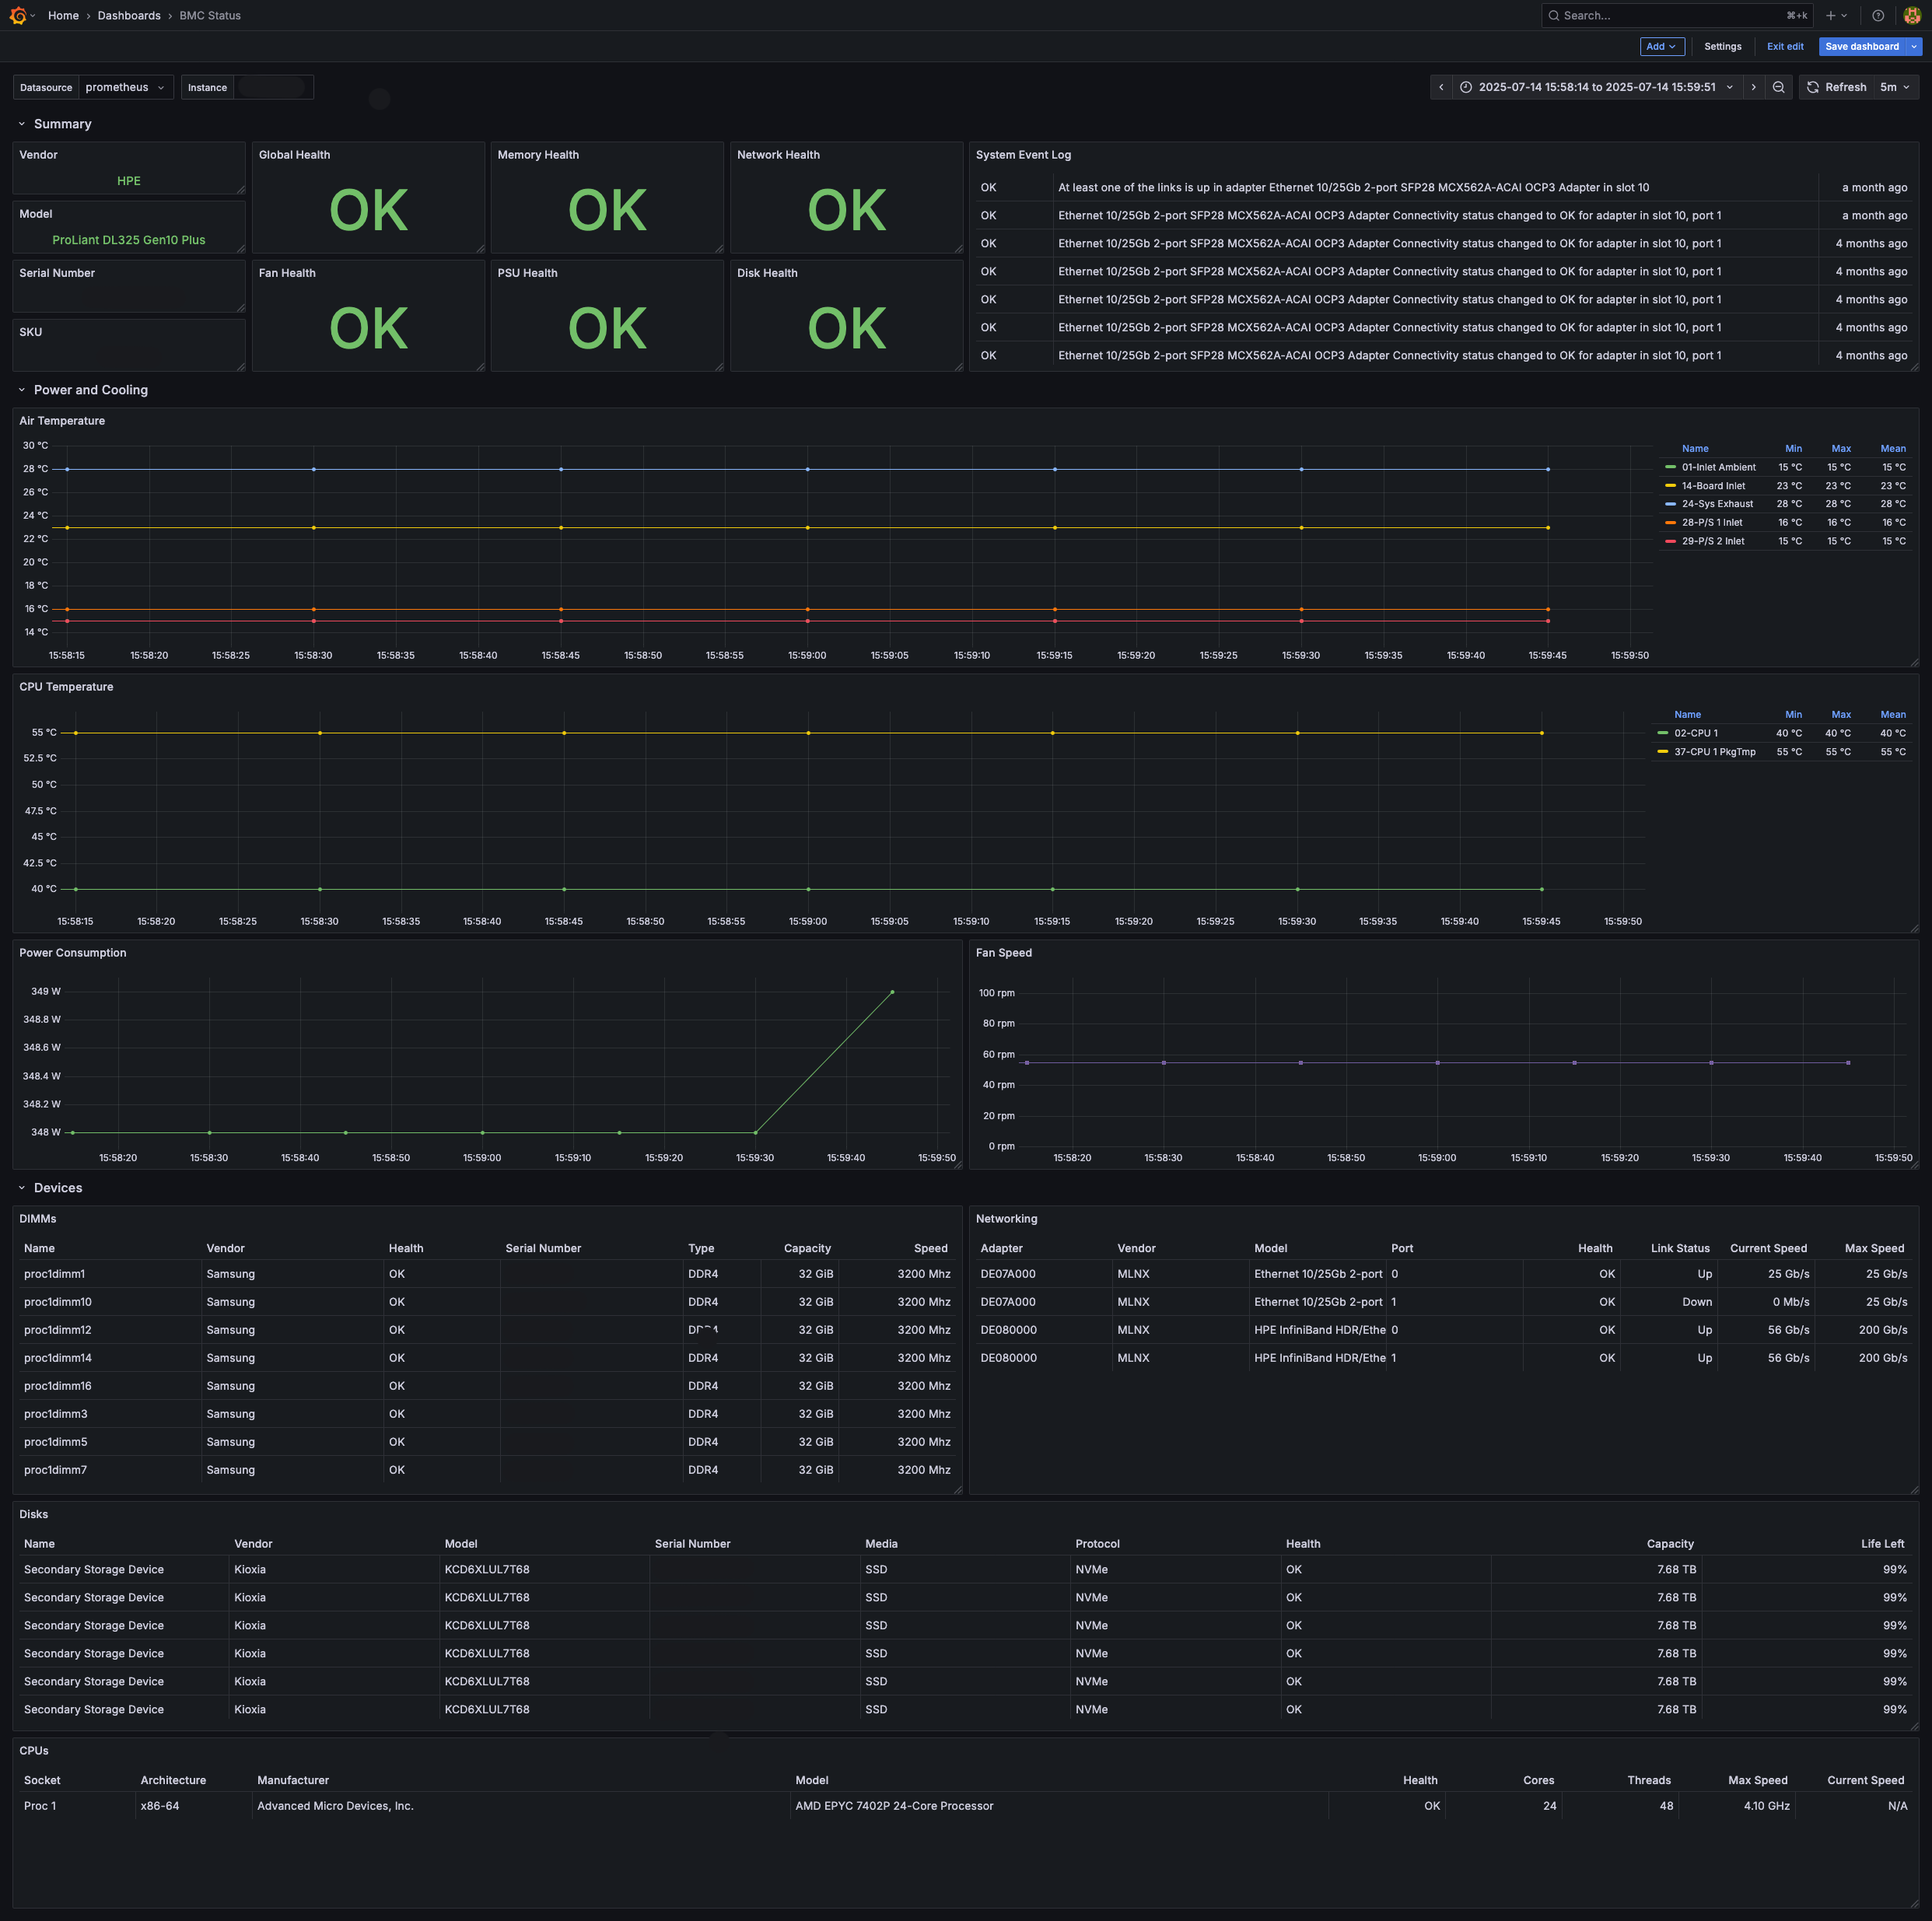
Alternative per-machine status (grafana/status-alternative.json):
Conventions
- Panels read from the provisioned
Prometheusdatasource and key off a singlesystemtemplate variable (label_values(idrac_system_machine_info, system)) so one stack can show many machines.systemis the canonical host-identity label across both export paths: - OTLP/snapshot path: the exporter injects it automatically (configurable via
otlp.identity_label, defaultsystem). - On-demand scrape-all path: the exporter injects
system(andinstance) per host on a bare/metrics; Prometheus keeps them withhonor_labels: true. For per-target (?target=) scraping, setsystemvia a relabel rule instead — see the Docker Compose quickstart. - Health metrics map
0 = OK,1 = Warning,2 = Critical. - Any per-second gauge is aggregated with
sum/avgin PromQL — neverrate()(the exporter already exposes instantaneous values).